Blog

  • Master Your Money: Side Hustle Income Tracker Guide

    Master Your Money: Side Hustle Income Tracker Guide

    Introduction

    So, you’ve joined the millions of “gig economy” go-getters. Whether you’re flipping vintage furniture on weekends, writing code after your 9-to-5, or driving for a rideshare app, you are officially a micro-entrepreneur. But here is the cold, hard truth: if you aren’t tracking your money, you aren’t running a business—you’re just busy.

    Managing multiple income streams can quickly turn into a mental jigsaw puzzle. Without a dedicated Side Hustle Income Tracker, it’s nearly impossible to know if you’re actually making a profit after gas, software subscriptions, and materials are paid for. Worse yet, tax season becomes a frantic scramble through crumpled receipts and bank statements. This guide explains how a tracking tool transforms that chaos into clarity, ensuring that every hour of your “extra” work truly pays off.

    What is a Side Hustle Income Tracker and Why it Matters

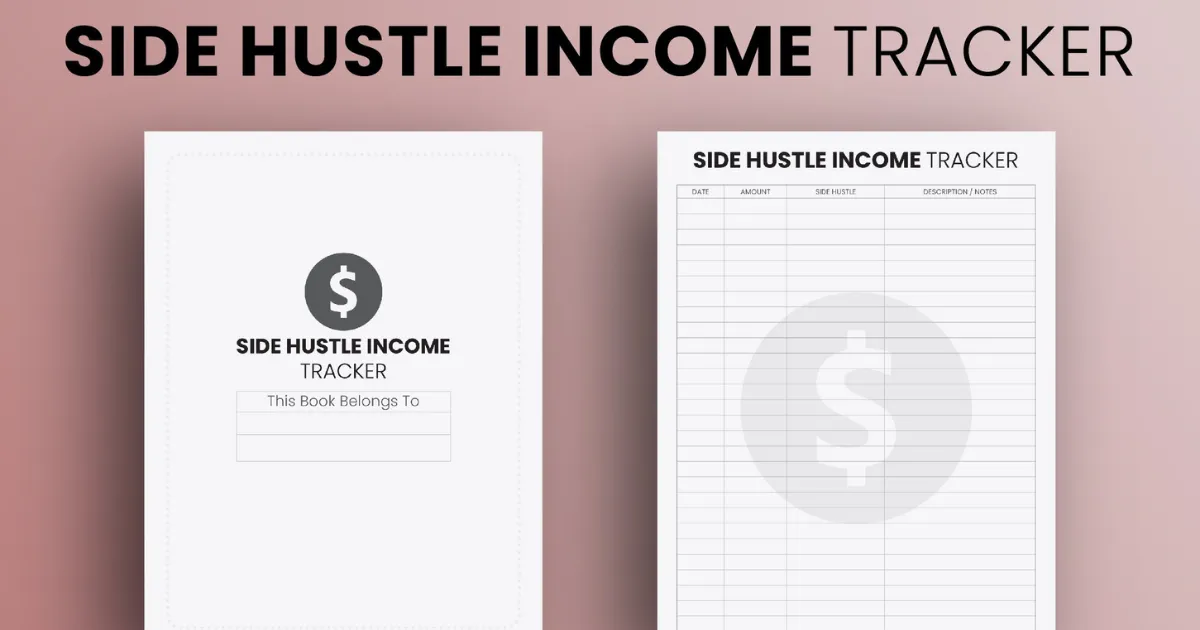
    A Side Hustle Income Tracker is a specialized system—ranging from a simple spreadsheet to a robust mobile app—designed to log every dollar that enters and leaves your side business. Unlike a standard personal budget, this tool focuses specifically on the “top-line” revenue (what clients pay you) and the “bottom-line” profit (what you actually keep).

    Why It’s Non-Negotiable

    • Tax Compliance: In many regions, earning as little as $400-$600 annually triggers a reporting requirement. A tracker ensures you have an audit-ready trail of your earnings.
    • Expense Optimization: Many new hustlers forget that “spending money to make money” is often tax-deductible. If you don’t track the $20 you spent on a premium LinkedIn account or the $50 in craft supplies, you’re essentially paying the government more than you should.

    Time Value Analysis: By tracking hours alongside income, you can see if your $50-an-hour consulting gig is actually a $10-an-hour slog once prep time is factored in. It helps you decide which “hustles” to scale and which to scrap.

    Step-by-Step Guide: How to Use Your Tracker Effectively

    Ready to get organized? Follow these steps to set up a system that works for you:

    • Step 1: Choose Your Platform. Decide between a manual Google Sheet, a dedicated app like QuickBooks Self-Employed, or a simple notebook. (Digital is usually better for searching and calculating).
    • Step 2: Create Your Categories. Standardize your labels. Common income categories include “Client Payments” or “Ad Revenue.” Expense categories should include “Software,” “Marketing,” “Travel,” and “Supplies.”
    • Step 3: Log Every Transaction Immediately. Don’t wait until the end of the month. Set a “Sunday Reset” ritual to enter any data you missed during the week.
    • Step 4: Digitize Your Receipts. Use your phone to snap photos of physical receipts. Most tracking tools allow you to attach these images directly to an expense entry.
    • Step 5: Separate Your Banking. Even for a small hustle, opening a separate (even if it’s just a second personal) bank account makes tracking 100% easier because you won’t have to filter out your grocery bills.
    • Step 6: Review Your Monthly “Net.” At the end of each month, compare your total income against your expenses to see your true growth.

    The Math Behind the Hustle: Understanding Profitability

    You don’t need an accounting degree to track your hustle, but you do need to understand two basic formulas. These numbers tell you the “health” of your side business.

    1. The Net Income Formula

    This is the most important number. It tells you exactly how much money is actually landing in your pocket after all costs.

    $$Net\ Income = Total\ Revenue – (Cost\ of\ Goods\ Sold + Operating\ Expenses)$$

    2. Profit Margin Percentage

    This tells you how efficient your hustle is. A higher percentage means you keep more of every dollar you earn.

    $$Profit\ Margin = \left( \frac{Net\ Income}{Total\ Revenue} \right) \times 100$$

    If you earn $1,000 but spend $400 on supplies, your Net Income is $600. Your Profit Margin is 60%. If your margin starts dropping below 20-30%, it’s a sign you need to either raise your prices or cut your costs.

    Real-Life Scenarios: See the Tracker in Action

    Scenario A: The Freelance Graphic Designer

    Sarah earns $2,000 in a month from three clients. She pays $50 for her Adobe subscription and $150 for a new font pack. Her tracker shows a Net Income of $1,800. Because she tracked her hours (40 hours total), she knows her “Effective Hourly Rate” is $45/hour.

    Scenario B: The E-commerce Crafter

    Mark sells $500 worth of hand-painted coasters on Etsy. He spends $200 on wood and paint, and Etsy takes $40 in fees. His tracker reveals his Net Profit is $260. While his revenue looked high ($500), his Profit Margin is 52%. This helps him realize he needs to buy supplies in bulk to lower his costs.

    FAQs: Frequently Asked Questions

    Q1: Do I really need to track income if I make less than $1,000?

    Yes. Even if you don’t owe significant taxes, tracking helps you understand if the side hustle is worth your time. Plus, if you ever want to scale it into a full-time business, having historical data is vital for getting loans or investors.

    Q2: What counts as a “tax-deductible” expense?

    Generally, any expense that is “ordinary and necessary” for your business. This can include a portion of your internet bill, home office space, mileage driven for work, and professional development courses.

    Q3: Should I use a spreadsheet or an app?

    Spreadsheets are free and highly customizable, but apps (like Wave or Mint) can often sync directly to your bank account, which saves hours of manual data entry. Start with a spreadsheet; upgrade to an app once you’re making more than $500/month consistently.

    Conclusion & CTA

    Tracking your side hustle income is the difference between having a hobby and having a business. By using a Side Hustle Income Tracker, you gain the power to make data-driven decisions, save money on taxes, and ultimately grow your wealth faster. Don’t let your hard-earned cash slip through the cracks of unorganized bank statements!

  • Master the Conversion: Grams to Tablespoons Made Easy

    Master the Conversion: Grams to Tablespoons Made Easy

    If you’ve ever been halfway through a batch of chocolate chip cookies only to realize your scale’s batteries are dead, you know the sudden spike of kitchen panic. You’re looking at a recipe that demands “125g of butter,” but all you have in your drawer is a set of measuring spoons. How do you bridge the gap between weight and volume without ruining your bake?

    Kitchen conversions can feel like a high-stakes math test, especially when accuracy is the difference between a fluffy cake and a literal brick. This guide is designed to be your digital sous-chef. We’re stripping away the confusion and providing you with a reliable way to convert Grams to Tablespoons for all your favorite ingredients. Whether you are a professional pastry chef or a weekend warrior in the kitchen, understanding these conversions ensures your results are consistent, delicious, and stress-free every single time.

    What is Grams to Tablespoons and Why it Matters

    In the culinary world, there are two main ways to measure ingredients: mass (grams) and volume (tablespoons). Grams are the gold standard for professional baking because they represent a precise weight that doesn’t change based on how tightly you pack an ingredient. Tablespoons, on the other hand, are a measure of the space an ingredient occupies.

    The importance of this conversion lies in the density of what you are cooking with. A tablespoon of lead would weigh much more than a tablespoon of feathers; similarly, a tablespoon of granulated sugar is much heavier than a tablespoon of cocoa powder.

    If you ignore these differences and use a “one-size-fits-all” conversion, your recipes will suffer. Too much flour makes bread tough; too little sugar prevents browning. Master the conversion, and you master the science of the kitchen. It allows you to follow international recipes from Europe (which favor grams) or the US (which favor volume) with total confidence.

    Step-by-Step Guide: How to Convert Like a Pro

    Converting grams to tablespoons doesn’t have to be a guessing game. Follow these steps to ensure your measurements are as accurate as possible:

    • Identify Your Ingredient: Density is key. Determine if you are measuring a liquid (water, oil), a dry powder (flour, powdered sugar), or a granular solid (salt, white sugar).

    • Use the Standard Ratio: As a baseline, remember that for water, 15 grams equals 1 tablespoon.

    • Aerate Your Dry Goods: If measuring flour or cocoa, fluff it up with a fork before scooping. This prevents “packing,” which adds extra grams to your tablespoon.

    • The Spoon-and-Level Method: To get a “true” tablespoon, scoop the ingredient into the spoon until it overflows, then use the back of a flat knife to level it off. Never pack it down unless the recipe specifically says “packed.”

    • Consult a Conversion Chart: Since every ingredient has a different weight, use a quick reference table for the most common items:

    • All-Purpose Flour: 1 tbsp ≈ 8g
    • Granulated Sugar: 1 tbsp ≈ 12.5g
    • Butter: 1 tbsp ≈ 14g
    • Milk/Water: 1 tbsp ≈ 15g
    • Cocoa Powder: 1 tbsp ≈ 7g

    The Math Behind the Measurements

    To convert grams to tablespoons mathematically, we use the concept of density. The basic formula for finding the volume ($V$) when you know the mass ($m$) and the density ($\rho$) is:

    $$V = \frac{m}{\rho}$$

    In the kitchen, we simplify this. Since 1 tablespoon is defined as approximately 14.79 milliliters, and for water, 1 gram equals 1 milliliter, the math for a liquid is straightforward. However, for dry goods, we use a conversion factor based on the specific density of the ingredient.

    The general formula for kitchen use is:

    $$\text{Tablespoons} = \frac{\text{Grams}}{\text{Grams per Tablespoon of the specific ingredient}}$$

    For example, if you have 100 grams of sugar and you know that sugar is roughly 12.5 grams per tablespoon, you would calculate:

    $$100 / 12.5 = 8 \text{ tablespoons}$$

    Real-Life Scenarios

    Scenario 1: The Holiday Cake

    You are following a vintage French recipe that calls for 200g of white sugar. You don’t have a scale. Since granulated sugar is roughly 12.5g per tablespoon, you divide 200 by 12.5.

    Result: You need exactly 16 tablespoons (which is also 1 cup) to keep that cake perfectly sweet.

    Scenario 2: The Morning Roux

    You’re making a gravy and need 30g of all-purpose flour. Flour is lighter than sugar, weighing in at about 8g per tablespoon.

    Result: $30 / 8 = 3.75$. You should use 3 level tablespoons plus 2 teaspoons to get the thickness just right.

    FAQs (Frequently Asked Questions)

    1. Is a “heaping” tablespoon the same as a standard tablespoon?

    No. A standard tablespoon in a recipe always refers to a level tablespoon. A “heaping” spoon can contain up to 50% more ingredient, which can easily ruin the chemistry of a baking recipe.

    2. Does it matter if I use a US tablespoon vs. a UK tablespoon?

    Slightly. A US tablespoon is $14.79\text{ ml}$, while a UK tablespoon is exactly $15\text{ ml}$. For most home cooking, the difference is negligible, but for very small, precise bakes, it’s best to stick to one measurement system throughout the recipe.

    3. Why is my flour measurement always different?

    Flour is notorious for settling. If you dip the tablespoon directly into a tightly packed bag, you might get 12g. If you sift it first, you might get 7g. Always “fluff, scoop, and level” for the best accuracy.

    Conclusion & CTA

    Converting grams to tablespoons is an essential skill that transforms you from a recipe-follower into a confident chef. While a digital scale is always the most precise tool, understanding the density and the math behind your ingredients ensures you’re never sidelined by a missing piece of equipment.

    Ready to take your baking to the next level? Bookmark this guide for your next kitchen session, or better yet, grab our printable conversion chart to hang on your fridge so you never have to guess again!

  • Master the Debt-Free Drive: Car Loan Prepayment Calculator Guide

    Master the Debt-Free Drive: Car Loan Prepayment Calculator Guide

    Buying a car is an exhilarating milestone, but the monthly sting of loan installments can quickly dampen the joy of the open road. If you’ve ever looked at your bank statement and wondered how much faster you could own your vehicle outright, you’re not alone. The secret isn’t just earning more—it’s paying smarter.

    A Car Loan Prepayment Calculator is the ultimate financial roadmap for anyone looking to shave months, or even years, off their debt. By making extra payments toward your principal balance, you aren’t just lowering your debt; you’re effectively “buying back” the interest you would have paid to the bank. Whether you’ve received a work bonus, a tax refund, or simply tightened your monthly budget, this tool shows you exactly how those extra dollars translate into freedom. In this guide, we’ll explore how small shifts in your payment strategy can lead to massive savings.

    What is a Car Loan Prepayment and Why it Matters

    In the world of financing, a “prepayment” refers to any amount paid toward your loan principal above and beyond your scheduled monthly installment. Most standard car loans are front-loaded with interest due to an amortization schedule. This means that in the early years of your loan, a larger chunk of your check goes to the bank’s profit rather than the actual car value.

    Why should you care?

    1. Interest Savings: Because interest is calculated based on the remaining principal, reducing that balance early significantly lowers the total interest accrued over time.

      Improved Cash Flow: Shortening your loan term means you reach a “payment-free” lifestyle sooner, freeing up hundreds of dollars for investments or travel.

      Equity Building: Cars are depreciating assets. Prepaying helps you stay “above water,” ensuring you don’t owe more than the car is worth if you decide to sell or trade it in.

      Using a Car Loan Prepayment Calculator empowers you to see the “future value” of your current money, turning abstract numbers into a concrete exit strategy.

    Step-by-Step Guide: How to Use the Calculator

    Using the tool is straightforward, but accuracy is key to getting a realistic timeline. Follow these steps to map out your savings:

    Gather Your Current Loan Details: You will need your current loan balance, the remaining term (in months), and your annual interest rate (APR).

    Input Your Regular Payment: Enter the amount you currently pay every month.

    • Define Your Prepayment Strategy: Most calculators offer two options:

      • Monthly Extra: A consistent amount added to every check (e.g., an extra $50/month).

      • One-Time Lump Sum: A single large payment (e.g., a $2,000 tax refund).

    • Adjust the “Start Date”: Select when you plan to begin these extra payments to see the most accurate impact.

    • Analyze the Comparison: The tool will generate a side-by-side view showing your “Original Payoff Date” vs. your “New Payoff Date.”

    • Check for Penalties: Before finalizing your plan, contact your lender to ensure your specific loan doesn’t have “prepayment penalties”—though these are increasingly rare in modern auto lending.

    The Math Behind the Savings

    You don’t need to be a mathematician to use the tool, but understanding the logic helps you appreciate the results. Car loans typically use the Simple Interest Formula, but the magic happens through Amortization.

    The interest for a single period is calculated as:

    $$I = P \times \frac{r}{n}$$

    Where:

    • $P$ is the remaining Principal balance.

    • $r$ is the annual interest rate (decimal).

    • $n$ is the number of payments per year (usually 12).

    When you make a prepayment, you are directly reducing $P$. Because the interest ($I$) for the next month is calculated based on that new, lower $P$, the amount of your “regular” payment that goes toward interest shrinks, and the portion that goes toward the principal grows. This creates a “snowball effect” where your debt disappears at an accelerating rate.

    Real-Life Scenarios

    Scenario A: The “Daily Coffee” Strategy

    Imagine Sarah has a $25,000 loan at 6% interest for 60 months. Her standard payment is roughly $483. By simply cutting back on small luxuries and adding $50 extra every month, she saves over $550 in interest and pays off her car 7 months early.

    Scenario B: The Tax Refund Boost

    Mark has the same loan but decides to make a one-time lump sum payment of $3,000 using his year-end bonus in the 12th month of his loan. This single action slashes his interest costs by nearly $1,100 and moves his “freedom date” up by 9 months.

    Frequently Asked Questions (FAQs)

    1. Will prepaying my car loan hurt my credit score?

    Initially, you might see a tiny, temporary dip when the account closes because you have one less “active” credit line. However, the long-term benefit of a lower debt-to-income ratio far outweighs this minor fluctuation.

    2. Is it better to pay a lump sum or monthly extras?

    Mathematically, the earlier you pay, the more you save. A lump sum at the beginning of the loan is more effective than the same amount spread over several years, as it stops interest from compounding sooner.

    3. Should I pay off my car loan if I have other debts?

    Generally, you should prioritize debts with the highest interest rates (like credit cards). If your car loan is at 4% but your credit card is at 22%, pay the card first!

    Conclusion & CTA

    A car is a tool for freedom, but a car loan can feel like an anchor. By utilizing a Car Loan Prepayment Calculator, you take the guesswork out of your financial future and take back control from the banks. Whether it’s an extra $20 a month or a one-time windfall, every dollar counts toward your goal of total ownership.

    Ready to see how much you can save? Use our Car Loan Prepayment Calculator today and find out exactly how soon you can toss those monthly bills out the window!

  • Freelancer Tax Calculator 2026: Estimate Your Self-Employment Savings

    Freelancer Tax Calculator 2026: Estimate Your Self-Employment Savings

    Managing your finances as a freelancer can feel like a full-time job in itself, especially when the tax season rolls around. Unlike traditional employees who see taxes disappear from their paychecks automatically, independent contractors, gig workers, and solopreneurs are responsible for calculating and paying their own way. With the updated Freelancer Tax Calculator 2026, you can take the guesswork out of your financial planning. This tool is designed to help you navigate the complexities of self-employment tax, income tax brackets, and those all-important deductions that keep more money in your pocket.

    Understanding your tax liability is about more than just compliance; it is about empowerment. When you know exactly how much to set aside for the IRS or your local tax authority, you can invest in your business with confidence. Whether you are a graphic designer in New York or a software developer in Lahore, our 2026 calculator adapts to the latest tax laws, including the 15.3% self-employment rate and the newly adjusted standard deductions. Let’s dive into how this tool works and why it is the most critical asset in your freelance toolkit this year.

    What is the Freelancer Tax Calculator 2026 and Why it Matters

    The Freelancer Tax Calculator 2026 is a specialized digital tool built to estimate the total tax burden for individuals who work for themselves. In a traditional job, your employer pays half of your Social Security and Medicare taxes (FICA). However, as a freelancer, you are both the employer and the employee, meaning you are responsible for the full 15.3% self-employment tax. This calculator simplifies that math, factoring in your gross income, business expenses, and specific 2026 tax year thresholds.

    Why does this matter? For starters, the Social Security wage base has increased to $184,500 for 2026. If you are a high-earner, failing to account for these shifts can lead to a massive “tax surprise” in April. Furthermore, the calculator helps you determine your Estimated Quarterly Payments. The IRS requires most freelancers to pay taxes in four installments throughout the year. If you underpay, you could face penalties. By using this tool, you ensure that you are staying compliant while also maximizing your “Above-the-Line” deductions, such as health insurance premiums and home office costs, which are vital for reducing your taxable income.

    Step-by-Step Guide: How to Use the Tool

    Using the Freelancer Tax Calculator 2026 is straightforward. Follow these steps to get an accurate picture of your financial standing:

    • Gather Your Gross Income: Total all the payments you have received (or expect to receive) from clients across the entire 2026 calendar year.

    • Input Business Expenses: Enter your “deductible” costs. This includes software subscriptions, hardware (like a new laptop), marketing fees, and travel.

    • Select Your Filing Status: Choose whether you are filing as Single, Married Filing Jointly, or Head of Household, as this significantly changes your 2026 standard deduction ($16,100 for individuals).

    • Account for Self-Employment Tax: The tool automatically applies the 15.3% rate to 92.35% of your net earnings (the portion the IRS deems taxable).

    • Review Your QBI Deduction: The calculator will estimate your Qualified Business Income (QBI) deduction, which typically allows you to deduct 20% of your business income from your federal income tax.

    • Download the Summary: Once the calculation is complete, save your results to help you set aside the correct amount in a high-yield savings account for tax day.

    The Math and Formula Behind the Calculations

    The magic of the Freelancer Tax Calculator 2026 lies in its multi-layered formulas. To calculate your total liability, the tool follows the IRS “Schedule SE” logic. First, it identifies your Net Profit, which is simply:

    $$\text{Gross Income} – \text{Business Expenses} = \text{Net Profit}$$

    However, you don’t pay self-employment tax on 100% of that profit. The IRS allows you to multiply your net profit by 0.9235 (92.35%) to account for the employer-portion deduction. The formula for your Self-Employment (SE) Tax is:

    $$\text{SE Tax} = (\text{Net Profit} \times 0.9235) \times 0.153$$

    For the Income Tax portion, the tool subtracts 50% of your SE tax and your Standard Deduction from your total income to find your taxable income. It then applies the 2026 progressive tax brackets (ranging from 10% to 37%). Finally, it subtracts the QBI Deduction, which is generally:

    $$\text{QBI Deduction} = \text{Net Business Income} \times 0.20$$

    Real-Life Scenarios: Tax Planning in Action

    To see how the numbers play out, consider these two common 2026 freelance profiles:

    Scenario A: The Creative Freelancer

    Sarah is a freelance writer earning $60,000 annually with $5,000 in expenses (internet, laptop, and coworking). Her net profit is $55,000.

    • SE Tax: ~$7,770

    • Income Tax: After the $16,100 standard deduction and QBI benefits, her income tax is significantly lowered.

    • Total Savings Needed: Sarah should set aside roughly 20-22% of her gross pay to be safe.

    Scenario B: The High-Earning Consultant

    Marcus is a tech consultant earning $200,000 with $20,000 in expenses. Because his income exceeds the $184,500 Social Security cap, he stops paying the 12.4% Social Security tax on everything above that limit. However, he must pay an additional 0.9% Medicare surtax on income over $200,000.

    • Benefit: Marcus saves thousands by hitting the Social Security ceiling.

    • Total Savings Needed: Marcus should set aside roughly 28-30% of his income.

    FAQs: Frequently Asked Questions

    1. Do I have to pay taxes if I earned less than $1,000?

    Yes, if your net earnings from self-employment were $400 or more, you are required to file a tax return and pay self-employment tax.

    2. What is the “92.35%” rule used in the calculator?

    The IRS realizes that regular employees only pay half of FICA. To make it fair, they let freelancers calculate their tax on only 92.35% of their earnings, which essentially mimics the deduction an employer would get.

    3. Can I deduct my health insurance premiums?

    Absolutely. As a freelancer, you can often take an “above-the-line” deduction for health insurance premiums for yourself, your spouse, and your dependents, provided you weren’t eligible for an employer-sponsored plan elsewhere.

    Conclusion & CTA

    Navigating the 2026 tax landscape doesn’t have to be a source of anxiety. By using a dedicated Freelancer Tax Calculator, you transition from “hoping for the best” to “planning for success.” Remember, every dollar you identify as a legitimate business expense or a QBI deduction is a dollar that stays in your business to help you grow.

    Ready to see your 2026 estimate? Use our Freelancer Tax Calculator today to get a precise breakdown of your obligations and start your path toward a stress-free tax season!

  • Why the SIP Delay Cost Calculator is Your Financial Wake-Up Call

    Why the SIP Delay Cost Calculator is Your Financial Wake-Up Call

    We’ve all been there. You tell yourself, “I’ll start my investment next month once I’ve cleared this credit card bill,” or “I’ll wait until I get that year-end bonus.” It feels like a small, harmless delay. After all, what’s a few months or even a couple of years in the grand scheme of a thirty-year career?

    The truth is, in the world of compounding, time is a much more powerful engine than the amount of money you invest. Delaying your Systematic Investment Plan (SIP) by even six months doesn’t just mean you missed six payments; it means you’ve lopped off the most profitable period of your investment’s life: the final years. The SIP Delay Cost Calculator is a specialized tool designed to show you exactly how much that “next month” is costing you in real dollars. It’s a reality check that quantifies the invisible price of procrastination, helping you bridge the gap between “someday” and “today.”

    What is an SIP Delay Cost Calculator and Why it Matters

    A SIP Delay Cost Calculator is a digital financial tool that compares two investment scenarios: starting your SIP today versus starting it at a later date. By inputting your intended monthly investment, the expected rate of return, and the duration of the delay, the tool calculates the “Opportunity Cost”—the wealth you lose because your money had less time to compound.

    Why It Matters

    The importance of this tool lies in its ability to expose the Power of Compounding. Compounding works exponentially, not linearly. This means the growth you see in Year 25 of an investment is significantly higher than the growth in Year 5. When you delay the start, you aren’t just missing the “early” interest; you are effectively deleting the “peak” interest years at the end of your cycle.

    Using this calculator matters because it shifts your perspective from saving to timing. Many investors wait until they have a “large enough” sum to start, but the SIP Delay Cost Calculator proves that starting small today is almost always better than starting large tomorrow. It provides the motivation needed to maintain discipline and highlights how a small delay of 2–5 years can potentially halve your final retirement corpus.

    Step-by-Step Guide: How to Use the SIP Delay Cost Calculator

    Using the tool is straightforward, but accuracy in your inputs will give you the most realistic “shock to the system.” Follow these steps to see your personal cost of delay:

    • Step 1: Define Your Monthly Contribution

    Enter the amount you plan to invest every month. Whether it’s $100 or $1,000, consistency is the key metric here.

    • Step 2: Set Your Investment Tenure

    Input the total number of years you plan to stay invested (e.g., 20 years until retirement).

    • Step 3: Estimate the Rate of Return

    Enter an expected annual return percentage. For equity-based mutual funds, many investors use a conservative estimate of 10% to 12% based on historical market averages.

    • Step 4: Input the Delay Period

    Specify how long you plan to wait before starting. You can usually toggle this between months or years. Try entering “1 year” just to see the impact.

    • Step 5: Analyze the Comparison

    The calculator will instantly generate two figures:

      1. The Target Wealth if you start today.

      2. The Target Wealth if you start after the delay.

    • Step 6: Review the “Cost of Delay”

      The difference between these two numbers is your cost of delay. This is the amount of wealth you are essentially “paying” for the privilege of waiting.

    The Math Behind the Magic: How It’s Calculated

    The SIP Delay Cost Calculator isn’t just guessing; it uses the standard Future Value (FV) of an Annuity formula. To understand the background science, we look at how interest is earned on both the principal and the accumulated interest over time.

    The formula for a standard SIP (invested at the beginning of the period) is:

    $$FV = P \times \left[ \frac{(1 + r)^n – 1}{r} \right] \times (1 + r)$$

    Where:

    • $P$ = Monthly investment amount.
    • $r$ = Monthly interest rate (Annual Rate / 12 / 100).
    • $n$ = Total number of months ($Years \times 12$).

    The Logic of Delay

    To find the cost of delay, the calculator runs this formula twice.

    1. Scenario A (No Delay): It uses the full $n$ (e.g., 240 months for 20 years).

    2. Scenario B (With Delay): It reduces $n$ by the number of months you delayed (e.g., 228 months if you delayed by one year).

    The “Cost of Delay” is simply $FV_A – FV_B$. The math proves that because $n$ is an exponent, even a small reduction in the value of $n$ leads to a massive drop in the final $FV$, especially as the tenure grows.

    Real-Life Scenarios: Seeing the Impact

    Let’s look at two practical examples to see how these numbers play out in the real world. In both cases, we will assume an expected annual return of 12%.

    Scenario 1: The “Just Five Years” Wait

    • The Goal: Invest $500/month for 25 years.

    • Start Today: Your final corpus would be approximately $948,817.

    • Delay by 5 Years: If you wait 5 years and invest for only 20 years, your corpus drops to $494,865.

    • The Cost: Waiting 5 years cost you $453,952—nearly half your potential wealth!

    Scenario 2: The “One Year” Procrastination

    • The Goal: Invest $1,000/month for 30 years.

    • Start Today: Your final corpus would be approximately $3,529,913.

    • Delay by 1 Year: Your final corpus drops to $3,141,400.

    • The Cost: That “harmless” 12-month delay cost you $388,513. You could have bought a house with the money lost to just one year of waiting.

    FAQs: Frequently Asked Questions

    1. Can I make up for a delay by investing more later?

    Yes, but it is expensive. To reach the same goal as someone who started early, you often have to double or triple your monthly investment. The calculator can help you find the “Step-up” amount needed to bridge that gap.

    2. Is the SIP Delay Cost Calculator accurate for all markets?

    The calculator uses a fixed rate of return for projection purposes. While real-market returns fluctuate, the principle remains the same: more time in the market beats trying to “time” the market.

    3. Does the cost of delay include inflation?

    Most basic calculators do not account for inflation. However, if you want a more realistic view, you can subtract the inflation rate (e.g., 5%) from your expected return (e.g., 12%) and enter 7% as your return rate in the tool.

    Conclusion & CTA

    The numbers don’t lie: time is the most valuable asset in your portfolio. As the SIP Delay Cost Calculator demonstrates, every month you spend on the sidelines is a month of compounding you can never get back. Don’t let the search for the “perfect” fund or the “perfect” time stop you from building your future.

    Ready to see what your “someday” is costing you? Use our tool today to calculate your specific delay cost and take the first step toward financial freedom. Start your SIP now—your future self will thank you.

    Know more: Smartcalc……….