Category: Health, Lifestyle & Tools

  • The Ultimate Tire Size Comparison Calculator Guide

    The Ultimate Tire Size Comparison Calculator Guide

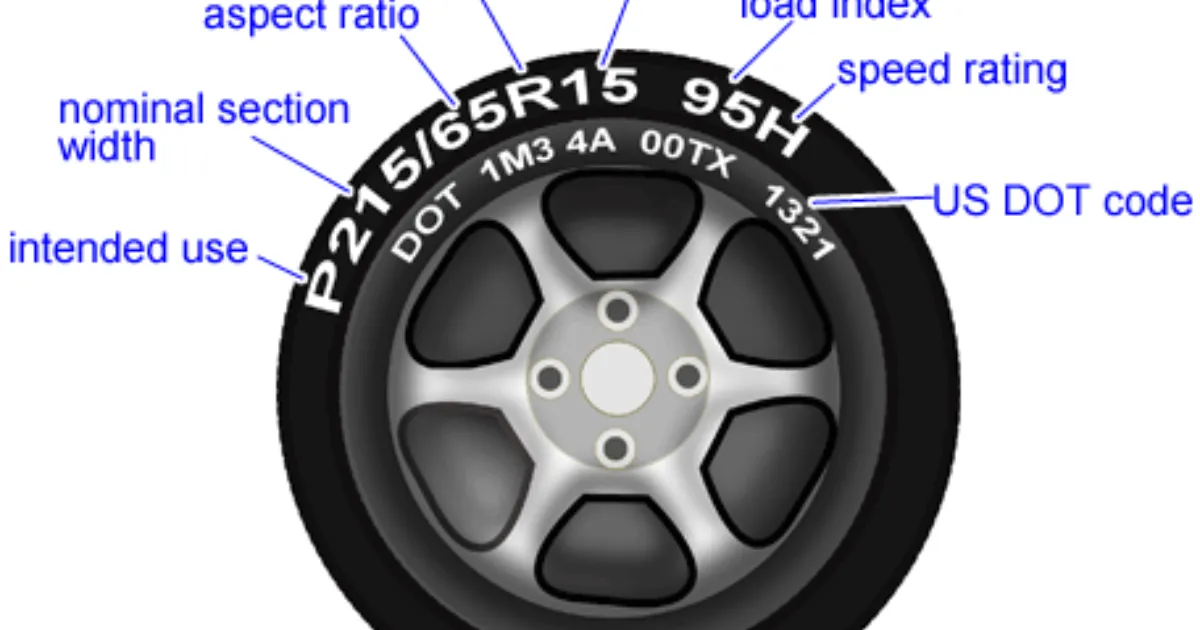
    Upgrading your wheels or tires is one of the most exciting ways to customize your vehicle, but it’s also one of the easiest ways to accidentally mess up your car’s performance. If you’ve ever looked at a sidewall and seen a string of confusing numbers like 245/40R18, you know the struggle. Choosing a tire that is too tall might rub against your wheel well, while one that is too short can make your speedometer lie to you. This is where a Tire Size Comparison Calculator becomes your best friend. Instead of guessing and hoping for the best, you can see exactly how a new set of rubber changes your ride height, gear ratio, and speed readings before you spend a single cent at the shop.

    What is a Tire Size Comparison Calculator and Why it Matters

    A Tire Size Comparison Calculator is a digital tool designed to measure the physical differences between two different tire specifications. It takes the width, aspect ratio, and wheel diameter of your current setup and compares them against a potential new size.

    Why does this matter? Your vehicle’s computer is calibrated based on the factory tire’s rolling diameter. When you change that diameter, everything from your anti-lock braking system (ABS) to your fuel economy sensors can be thrown out of sync.

    • Speedometer Accuracy: If your new tires have a larger circumference, your speedometer will report a speed lower than what you are actually traveling.
    • Clearance Issues: Larger tires can “rub” against the suspension or fenders during sharp turns.

      Performance: Wider tires offer better grip but can increase rolling resistance and lower your MPG.

    • Aesthetics: Most drivers use these calculators to achieve that perfect “flush” look without sacrificing the car’s drivability.

    Step-by-Step Guide: How to Use the Calculator

    Using the tool is straightforward, but accuracy is key. Follow these steps to ensure you get the right data:

    • Locate Your Current Specs: Look at the sidewall of your current tires or the sticker inside your driver-side door jamb. You need three numbers (e.g., 225/45R17).
    • Input the “Current” Tire: Enter the Width (225), Aspect Ratio (45), and Rim Diameter (17) into the “Existing” column of the tool.
    • Input the “New” Tire: Enter the specifications of the tire size you are considering upgrading to.
    • Analyze the Diameter Difference: Look for the percentage of change. A general rule of thumb in the automotive industry is to stay within 3% of the original diameter to avoid mechanical issues.
    • Check the Speedometer Offset: The tool will show you “Actual Speed vs. Indicated Speed.” If it says 65 mph but you’re actually doing 68, you’ll need to decide if that’s a margin you’re comfortable with.
    • Review Side-by-Side Visuals: Most calculators provide a 2D overlay. Use this to check if the new tire will sit closer to your suspension components.

    The Math Behind the Rubber: How It’s Calculated

    Understanding tire math is simpler than it looks once you break down the metric and imperial mix. Let’s use the standard formula to find the Total Diameter ($D$) of a tire.

    The formula consists of the wheel diameter plus the height of two sidewalls (top and bottom). Since sidewall height is a percentage of the width, we calculate it like this:

    $$D = (W \times \frac{AR}{100} \times 2 / 25.4) + RD$$

    Where:

    • $W$ = Section Width (in millimeters)
    • $AR$ = Aspect Ratio (the percentage of the width)
    • $RD$ = Rim Diameter (in inches)
    • $25.4$ = The conversion factor from millimeters to inches

    For example, on a 245/40R18 tire:

    1. Sidewall Height: $245 \text{ mm} \times 0.40 = 98 \text{ mm}$.

    2. Total Sidewall (Top + Bottom): $98 \text{ mm} \times 2 = 196 \text{ mm}$.

    3. Convert to Inches: $196 / 25.4 \approx 7.72 \text{ inches}$.

    4. Total Diameter: $7.72 + 18 = 25.72 \text{ inches}$.

    Real-Life Scenarios

    Scenario 1: The Off-Road Enthusiast

    John wants to put “beefier” tires on his truck for weekend trails. His stock size is 265/70R17 ($31.6$ inches tall). He wants to move to 285/70R17 ($32.7$ inches tall).

    • The Result: The calculator shows a 3.5% increase in diameter. John now knows he might need a small leveling kit to prevent the tires from rubbing when he hits a bump off-road.

    Scenario 2: The Commuter Seeking Comfort

    Sarah drives a sedan with low-profile 225/40R18 tires. She finds the ride too bumpy and wants more “meat” on the sidewall, eyeing a 225/45R18.

    • The Result: This change increases the sidewall height by about $0.45$ inches. The calculator shows a 3.4% speed error. When her speedometer says 60 mph, she’s actually going 62 mph. She decides the extra comfort is worth the small speed discrepancy.

    Frequently Asked Questions (FAQs)

    1. Will a different tire size void my warranty?

    Generally, no, but it can affect claims related to the drivetrain or suspension if the manufacturer can prove the oversized tires caused premature wear on the wheel bearings or transmission.

    2. Can I change tire width without changing my wheels?

    Yes, but every rim has a “range” of widths it can safely support. A tire that is too wide for the rim will bulge (poor handling), and one that is too narrow will be “stretched” (safety risk).

    3. What is the “Aspect Ratio” exactly?

    It is the height of the sidewall expressed as a percentage of the width. In a 200/50 tire, the sidewall is $100\text{mm}$ tall (50% of 200).

    Conclusion & CTA

    Choosing the right tires is a balance of physics, safety, and style. By using a Tire Size Comparison Calculator, you remove the guesswork and ensure your vehicle remains safe and efficient. Whether you’re aiming for a rugged off-road look or a sleek street stance, always double-check your math before hitting the “buy” button.

    Ready to see how your new setup measures up? Plug your numbers into our Tire Size Comparison Calculator today and drive with peace of mind!

  • Gold Price Weight Converter: Mastering Tola to Gram Conversions

    Gold Price Weight Converter: Mastering Tola to Gram Conversions

    Navigating the world of precious metals can feel like learning a second language, especially when you encounter traditional units like the Tola. If you’ve ever walked into a jewelry shop in South Asia or checked gold rates online, you’ve likely seen prices quoted in both grams and tolas. But how do you know exactly what you’re paying for?

    The Gold Price Weight Converter (Tola to Gram) is your essential bridge between heritage and modern precision. Whether you are inheriting family heirlooms, planning a wedding purchase, or investing in gold bullion, understanding this conversion is the only way to ensure you aren’t overpaying. In this guide, we’ll break down why these units exist, the exact math used by jewelers today, and how you can use our conversion logic to trade gold like a pro.

    What is a Tola and Why Does it Matter?

    The Tola is a traditional unit of mass that has been the heartbeat of the gold trade in South Asia—specifically India, Pakistan, Bangladesh, and Nepal—for centuries. Its roots trace back to the Vedic period, derived from the Sanskrit word Tula, meaning a balance or scale. Historically, a tola was equivalent to the weight of 100 Ratti seeds, making it a natural, standardized way for ancient merchants to trade fairly.

    In the modern era, while the world has largely shifted to the metric system (grams and kilograms), the gold industry remains deeply sentimental. Most local “Sarafa” markets still quote daily rates in tolas. Understanding the Gold Price Weight Converter matters because:

    • Price Transparency: Global gold spot prices are quoted in Troy Ounces or Grams. To compare a local price to the international market, you must convert the weight accurately.
    • Jewelry Valuation: Most traditional jewelry designs are crafted based on tola weights (e.g., a “5-tola set”).
    • Investment Accuracy: When buying gold biscuits or coins, even a 0.1-gram discrepancy can lead to a significant financial difference given today’s high gold prices.

    Step-by-Step Guide: How to Convert Tola to Grams

    • Using a Gold Price Weight Converter is straightforward once you know which “standard” your jeweler is using. Follow these steps to get an exact measurement:
    1. Identify the Regional Standard: * International/Standard Tola: Used most officially, this is 11.6638 grams.
    2. Modern/Jeweler’s Tola: Many modern jewelers round this to 10 grams or 12 grams for easier math. Always ask: “How many grams are you counting in one tola?”
    3. Determine Your Total Tolas: Look at your gold receipt or the weight of the item you are interested in.
    4. Apply the Conversion Factor: * To get Grams, multiply your Tolas by 11.6638.
    5. To get Tolas, divide your Grams by 11.6638.
    6. Verify the Purity: Remember that the weight (grams) stays the same regardless of whether the gold is 22K or 24K, but the price will change based on that weight.
    7. Calculate the Final Value: Multiply the resulting gram weight by the current “Gold Price per Gram” in your city.

    The Math Behind the Gold Weight Conversion

    • The science of the Tola was standardized during the British Raj in 1833. It was defined as 180 troy grains. To understand how we arrive at the modern metric equivalent, we use the following relationship:
    • $$1 \text{ Tola} = 11.6638038 \text{ grams}$$
    • For most commercial purposes, this is rounded to 11.66 grams. If you are looking for the inverse (how many tolas are in a single gram), the formula is:
    • $$1 \text{ Gram} \approx 0.0857 \text{ Tolas}$$
    • In some specific markets, like Pakistan, a “local tola” is sometimes treated as exactly 12.5 grams (based on a different historical division where 1 kg = 80 tolas). However, the $11.66$ figure remains the most widely accepted standard for high-end gold trading.
    • Real-Life Scenarios: Tola vs. Gram in Action
    • To see how the Gold Price Weight Converter affects your wallet, let’s look at two practical examples:

    Scenario A: Buying a Wedding Set

    • Imagine you are buying a necklace that the jeweler says weighs 4.5 Tolas. If the current gold rate is $80 per gram, how much is the gold worth?
    • Conversion: $4.5 \times 11.6638 = 52.48 \text{ grams}$

    • Total Cost: $52.48 \times 80 = \$4,198.40$

    • Note: Without the converter, you might mistake 4.5 tolas for 45 grams, leading to a massive error in your budget!

    • Scenario B: Selling Heirloom Coins
    • You have three old gold coins that weigh a total of 35 grams on a kitchen scale. You want to know how many tolas that is to check the local newspaper rates.
    • Conversion: $35 \div 11.6638 = 3.00 \text{ Tolas}$

    • You now know you have exactly 3 tolas of gold to trade.

    FAQs: Frequently Asked Questions

    • 1. Is 1 Tola always equal to 10 grams?
    • No. While some jewelers use 10 grams as a “metric tola” to simplify calculations, the official and traditional weight is 11.6638 grams. Always clarify the conversion rate with your dealer before paying.
    • 2. Does the weight of a Tola change with gold purity (22K vs 24K)?
    • No, the weight remains the same. A tola is a measure of mass, not purity. However, a tola of 24K gold will be more expensive than a tola of 22K gold because it contains more pure gold content.
    • 3. Why do some countries use different weights for a Tola?
    • Tradition varies by region. For instance, in parts of Pakistan, a tola is often calculated as 12.5 grams to align with the “80 tolas per kilogram” rule. In India, 11.66 grams is the standard.
    • Conclusion & CTA
    • Understanding the Gold Price Weight Converter (Tola to Gram) is the hallmark of a savvy investor. By mastering the 11.6638 ratio, you protect yourself from market confusion and ensure every milligram of your precious metal is accounted for.
    • Ready to make an informed investment? Use our digital conversion tool today to get real-time weight calculations and stay ahead of the market!
  • Electric Unit Cost Calculator (LESCO/KElectric): Your Ultimate Guide to Lowering Bills

    Electric Unit Cost Calculator (LESCO/KElectric): Your Ultimate Guide to Lowering Bills

    Why Your Electricity Bill Is Rising and How to Control It

    Managing household expenses in Pakistan has become a significant challenge, with electricity costs leading the charge. Whether you are a resident of Lahore served by LESCO or living in the bustling metropolis of Karachi under K-Electric, understanding your bill is no longer optional—it is a necessity for financial survival.

    The Electric Unit Cost Calculator is a vital tool designed to strip away the complexity of “slabs,” “surcharges,” and “adjustments.” Many consumers are shocked to see their bills double even when their usage only increases by a few units. This happens because of the progressive slab system used by NEPRA. This guide and tool empower you to predict your monthly costs before the bill arrives, allowing you to adjust your consumption patterns in real-time. By the end of this article, you’ll not only know how to calculate your costs but also how to dodge the most expensive billing traps.

    What is the Electric Unit Cost Calculator and Why it Matters

    The Electric Unit Cost Calculator (LESCO/KElectric) is a specialized digital tool that computes your total electricity payable amount based on the current year’s tariff rates. In Pakistan, electricity is not sold at a flat rate; instead, the price per unit ($kWh$) increases as you cross specific thresholds known as “slabs.”

    Why This Tool is Essential in 2026

    As of March 2026, the energy landscape in Pakistan has seen several updates:

    • Slab Progression: Crossing the 200 or 300-unit mark can trigger a massive jump in the base rate, sometimes moving from Rs. 13 to over Rs. 30 per unit instantly.
    • Fuel Price Adjustments (FPA): These are monthly variables. For instance, in March 2026, an FPA of approximately Rs. 1.98 per unit was introduced to account for global fuel fluctuations.
    • Protected vs. Non-Protected Status: The government distinguishes between “Protected” consumers (those using consistently low energy) and “Non-Protected” consumers. The calculator helps you identify which category you fall into.

    Using this tool matters because it provides transparency. It breaks down the “hidden” costs like the Electricity Duty, PTV Fee, and GST, which often make up 20% to 30% of your total bill.

    Step-by-Step Guide: How to Use the Calculator

    Using the calculator is straightforward. Follow these steps to get an accurate estimate of your LESCO or K-Electric bill:

    1. Check Your Meter Reading: Go to your physical meter and note the current reading (the numbers followed by $kWh$). Compare this with the “Current Reading” on your previous month’s bill.

    2. Calculate Units Consumed: Subtract the old reading from the new one.

      • Example: $12,500$ (Current) – $12,200$ (Previous) = $300$ units.

    3. Select Your Provider: Choose LESCO (for Lahore and surrounding areas) or K-Electric (for Karachi) from the tool’s dropdown menu.

    4. Enter Your Connection Type: Select “Residential,” “Commercial,” or “Industrial.” Most homes use the A-1 Residential tariff.

    5. Input Consumed Units: Type the number of units you calculated in Step 2.

    6. Review the Breakdown: The tool will instantly generate a report showing:

    • Cost of Electricity: The price based on your specific slab.
    • FCA/QTA: The latest fuel and quarterly adjustments.
    • Government Taxes: GST, Income Tax, and Surcharges.

    7.Final Total: This is the amount you will likely see on your next bill.

    The Math Behind the Bill: Understanding the Formula

    Calculating an electric bill in Pakistan isn’t as simple as multiplying units by a single rate. It follows a Cumulative Slab Logic.

    The Base Formula

    The total cost of electricity ($TC$) is calculated as:

    $$TC = (U_1 \times R_1) + (U_2 \times R_2) + \dots + (U_n \times R_n) + Fixed\_Charges + Taxes$$

    Where:

    • $U$: Units within a specific slab.
    • $R$: The rate assigned to that slab.

    2026 Tariff Example (Non-Protected)

    • 1 – 100 Units: Approx. Rs. 22.44

    • 101 – 200 Units: Approx. Rs. 28.91

    • 201 – 300 Units: Approx. Rs. 33.10

    If you consume 250 units, you don’t pay Rs. 33.10 for all of them. The math works like this:

    1. First 100 units $\times$ 22.44 = Rs. 2,244

    2. Next 100 units $\times$ 28.91 = Rs. 2,891

    3. Remaining 50 units $\times$ 33.10 = Rs. 1,655

    4. Total Variable Cost: Rs. 6,790 (plus taxes and surcharges).

    Note: Once you cross 700 units, the rate for all units often jumps to the highest tier (e.g., Rs. 47.69 per unit), making the “cliff” very steep.

    Real-Life Scenarios

    Scenario 1: The “Protected” Small Household

    Ali lives in a small apartment and uses only fans and LED lights. He consumes 190 units. Because he has stayed under 200 units for six consecutive months, he is a Protected Consumer.

    • His Rate: Approx. Rs. 13.01 per unit.

    • Estimated Bill: ~Rs. 2,500 (low taxes).

    Scenario 2: The Summer Peak (AC Usage)

    Sara uses one Inverter AC during the night in Lahore (LESCO). Her total consumption hits 450 units.

    • Her Status: Non-Protected.

    • The Result: She enters the Rs. 40.22 slab.

    • Estimated Bill: Between Rs. 22,000 and Rs. 25,000 after including GST (18%), FPA, and Electricity Duty.

    Scenario 3: The Commercial Shop

    A small mobile shop in Karachi (K-Electric) uses 350 units. Commercial rates are higher, roughly Rs. 45.43 per unit flat.

    • Estimated Bill: ~Rs. 16,000 + Fixed charges.

    Frequently Asked Questions (FAQs)

    1. What is the difference between Protected and Non-Protected consumers?

    Protected consumers are those who use less than 200 units per month for six consecutive months. They enjoy a much lower base rate. Once you exceed 200 units in a single month, you risk losing this status and being moved to the significantly more expensive Non-Protected category.

    2. Why is my bill higher even if my units are the same as last month?

    This is usually due to Fuel Price Adjustment (FPA) or Quarterly Tariff Adjustment (QTA). These charges reflect the change in the cost of fuel (like LNG or Coal) used to generate power. For March 2026, a combined hike of Rs. 1.98 per unit was applied.

    3. Does the calculator include GST and other taxes?

    Yes, a professional calculator accounts for the 18% GST, Electricity Duty (1.5%), and the PTV Fee (Rs. 35). However, Income Tax is only applied to non-filers or bills exceeding certain thresholds.

    Conclusion & CTA

    Understanding your electricity costs is the first step toward energy independence. By using our Electric Unit Cost Calculator (LESCO/KElectric), you can stop guessing and start planning. Whether you need to decide if you should switch to Solar or simply want to know if you can afford to run the AC for another hour, this tool is your financial compass.

  • How Much is Your Phone Costing Your Health? Try This Screen Time Health Impact Calculator

    How Much is Your Phone Costing Your Health? Try This Screen Time Health Impact Calculator

    In 2026, the average adult spends nearly 7.5 hours a day staring at a screen. While our devices connect us to the world, they also tether us to sedentary habits that quietly erode our physical and mental well-being. From “tech neck” to disrupted sleep cycles, the cumulative effect of digital consumption is a modern epidemic.

    But how do you move from a vague feeling of “I use my phone too much” to actionable health data? This is where the Screen Time Health Impact Calculator becomes your most vital digital wellness ally. By quantifying your exposure, this tool helps you visualize the invisible strain on your eyes, the cortisol spikes from social scrolling, and the hours of movement you’re losing. In this guide, we’ll explore the science behind digital fatigue and show you exactly how to calculate—and mitigate—your personal health risk.

    What is a Screen Time Health Impact Calculator and Why it Matters

    A Screen Time Health Impact Calculator is a specialized digital assessment tool designed to evaluate the physiological and psychological risks associated with your daily device usage. Unlike a simple “time tracker” found in your phone settings, this calculator cross-references your total hours with health markers like sleep latency, metabolic rate, and musculoskeletal strain.

    Why It Matters

    Understanding your “digital dosage” is critical because screen time isn’t just about lost hours; it’s about biological interference.

    • Melatonin Suppression: High-energy visible (HEV) blue light mimics daylight, tricking your brain into staying awake and ruining your REM sleep.
    • The Sedentary Cascade: Every hour spent sitting is an hour your metabolism slows, increasing the risk of obesity and cardiovascular issues.
    • Cognitive Load: Constant notifications keep your brain in a state of “continuous partial attention,” leading to increased anxiety and decreased focus.

    By using a calculator, you transform abstract habits into concrete health metrics, allowing you to set boundaries before temporary strain becomes chronic damage.

    Step-by-Step Guide: How to Calculate Your Health Impact

    Using a Screen Time Health Impact Calculator is straightforward. Follow these steps to get an accurate picture of your digital footprint:

    1. Gather Your Data: Open your smartphone’s native tracking app (Screen Time on iOS or Digital Wellbeing on Android). Note your average daily hours over the last 7 days.
    2. Categorize Your Usage: Separate your hours into Productive (work/learning) and Recreational (social media/gaming/streaming). The health impact of recreational “doomscrolling” is typically higher due to increased dopamine-loop engagement.
    3. Input Your Sleep Habits: Note how many minutes before bed you last check your phone. If it’s under 60 minutes, your “Sleep Disruption Score” will increase.
    4. Evaluate Physical Symptoms: Check off any recurring issues: dry eyes, headaches, or stiffness in the neck and shoulders.
    5. Calculate the “Active Displacement” Ratio: Subtract your screen hours from your total waking hours. The calculator will determine if your “Movement Window” is sufficient for your age group.
    6. Review Your Risk Level: The tool will categorize you into Low, Moderate, or High Risk based on 2026 health guidelines.

    The Math Behind the Impact: The “Digital Strain” Formula

    While the biology of health is complex, researchers often use a simplified “Digital Strain Index” ($DSI$) to quantify the risk. The impact is generally dose-dependent, meaning the longer you stare without a break, the higher the physiological cost.

    The basic conceptual formula used by many calculators is:

    $$DSI = \left( \frac{H \times I}{B} \right) + S$$

    Where:

    • $H$ = Total Daily Screen Hours.

    • $I$ = Intensity Factor (Recreational content like TikTok/Gaming has a higher $I$ than E-books).

    • $B$ = Break Frequency (Using the 20-20-20 rule—every 20 minutes, look 20 feet away for 20 seconds—significantly lowers this value).
    • $S$ = Sleep Interference Constant (added if screens are used within 1 hour of bedtime).

    The math proves that even a small increase in break frequency ($B$) can exponentially lower your total strain, even if your total hours ($H$) remain high for work.

    Real-Life Scenarios: Seeing the Numbers in Action

    How do these calculations look for everyday people? Let’s look at three common profiles:

    Scenario 1: The Remote Professional (The “Productive Overloader”)

    • Usage: 9 hours (8h work, 1h personal).

    • Habit: Uses a monitor at eye level but forgets to blink.

    • Impact: High risk for Computer Vision Syndrome (CVS) and “Tech Neck.”
    • Calculation: High $H$, but if they take a break every 30 minutes, their $DSI$ drops by 40%.

    Scenario 2: The Social Scroller (The “Dopamine Loop”)

    • Usage: 5 hours (mostly social media).

    • Habit: Uses the phone in bed until the moment they fall asleep.

    • Impact: Severe sleep disruption and a 70% higher likelihood of reported anxiety.

    • Calculation: The $S$ (Sleep) constant in our formula doubles their health risk score despite having fewer total hours than the professional.

    Scenario 3: The Optimized User (The “Digital Minimalist”)

    • Usage: 3 hours.

    • Habit: No screens 90 minutes before bed; uses the 20-20-20 rule.

    • Impact: Low risk. Their metabolic rate remains stable because screen time is offset by 60 minutes of daily activity.

    Frequently Asked Questions (FAQs)

    1. Is blue light really that dangerous for my eyes?

    Current 2026 research indicates that while blue light from screens may not cause permanent blindness, it is the primary driver of Digital Eye Strain and circadian rhythm disruption. It forces your eyes to work harder to focus, leading to fatigue and headaches.

    2. How much screen time is “safe” for an adult?

    Most health organizations suggest limiting recreational screen time to less than 2 hours per day. For work-related usage, the “safety” depends on ergonomic setup and taking frequent visual and physical breaks.

    3. Can I reverse the health damage from too much screen time?

    Yes! Most symptoms like dry eyes, neck pain, and poor sleep improve within 7 to 14 days of implementing a “digital detox” or strict screen-free windows before bedtime.

    Conclusion & CTA

    Your devices should be tools for your success, not anchors for your health. By using a Screen Time Health Impact Calculator, you take the first step toward a more mindful, energized, and pain-free life. Whether you need to adjust your monitor height or set a “digital sunset” at 9 PM, the data will help you make the right choice.

    Ready to see your score? Use our interactive Screen Time Health Impact Calculator today and take control of your digital well-being!

  • Master Your Health with an Intermittent Fasting Window Calculator

    Master Your Health with an Intermittent Fasting Window Calculator

    Finding the right time to eat shouldn’t feel like solving a Rubik’s cube. If you’ve ever found yourself staring at the clock at 7:59 PM, wondering if you have time for one last snack before your fast starts, you aren’t alone. Intermittent fasting (IF) is incredibly effective, but the mental gymnastics of calculating 16:8 or 20:4 schedules can lead to “math fatigue” pretty quickly. This is where an Intermittent Fasting Window Calculator becomes your best friend. Instead of guessing when your next meal should be, this tool provides a clear, personalized roadmap for your day. It removes the friction of planning, allowing you to focus on how you feel rather than watching the seconds tick by.

    What is an Intermittent Fasting Window Calculator and Why it Matters

    At its core, an Intermittent Fasting Window Calculator is a digital assistant designed to align your eating habits with your biological clock. Intermittent fasting isn’t a diet in the traditional sense; it’s a pattern of eating. Whether you are following the popular 16:8 method (fasting for 16 hours and eating for 8) or the more intense One Meal a Day (OMAD) approach, the timing is everything.

    Why does this matter? Consistency is the secret sauce of IF. When you eat within a consistent window, your body enters a state of metabolic flexibility, learning to switch from burning glucose to burning stored fat. If your windows are constantly shifting because you miscalculated the time, your insulin levels stay erratic, and you might miss out on the cellular repair process known as autophagy. Using a calculator ensures you hit your fasting goals precisely, helping you manage hunger hormones like ghrelin and ensuring your body gets the metabolic rest it needs to thrive.

    Step-by-Step Guide: How to Use the Calculator

    Using an Intermittent Fasting Window Calculator is straightforward. Follow these steps to set up your schedule for maximum success:

    • Select Your Ratio: Choose the fasting protocol that fits your lifestyle (e.g., 14:10 for beginners, 16:8 for weight loss, or 18:6 for advanced fat burning).

    • Input Your Start Time: Enter the exact time you plan to finish your last meal of the day. For most people, this is dinner time.

    • Review Your “Fast-Break” Time: The calculator will automatically display the time you can have your first meal the following day.

    • Adjust for Lifestyle: If the calculated “break-fast” time lands in the middle of a busy meeting, adjust your start time until the window fits your daily routine.

    • Set Reminders: Use the output from the calculator to set alerts on your phone for 30 minutes before your window closes.

    Track Progress: Log your successful windows to see your consistency over weeks and months.

    The Math Behind the Fast

    The logic used by an Intermittent Fasting Window Calculator is based on a simple 24-hour cycle, but the science involves tracking the transition from a “fed state” to a “fasted state.”

    The basic formula used for a standard daily fast is:

    $$T_{break} = T_{finish} + T_{fast}$$

    Where:

    • $T_{break}$ is the time you break your fast.

    • $T_{finish}$ is the time you finished your last meal.

    • $T_{fast}$ is the duration of your fast (e.g., 16 hours).

    Mathematically, the calculator also ensures that $T_{fast} + T_{eat} = 24$. In more complex scenarios, such as the 5:2 method, the calculator shifts from hourly math to caloric math, ensuring that on “fasting days,” you consume only 25% of your Total Daily Energy Expenditure (TDEE). By automating these calculations, the tool prevents the common error of “under-fasting,” where a person unintentionally eats 15 hours in instead of 16, missing the peak fat-burning zone.

    Real-Life Scenarios

    Scenario 1: The Corporate Professional

    Sarah works a 9-to-5 job and struggles with late-night snacking. She uses the Intermittent Fasting Window Calculator to set a 16:8 schedule. She inputs her dinner finish time as 7:00 PM. The calculator tells her she can eat at 11:00 AM the next day. This allows her to skip a rushed breakfast, stay focused through her morning meetings, and enjoy a social lunch with colleagues.

    Scenario 2: The Night Owl

    Mark is a freelance designer who works late and sleeps until 10:00 AM. A traditional “no food after 6 PM” rule fails him. He sets his calculator to an 18:6 window. He finishes his final meal at 11:00 PM. The calculator shows his window opens at 5:00 PM the next day. By shifting his window later, he maintains his fast without sacrificing his creative flow during late-night hours.

    FAQs

    1. Can I drink coffee during my fasting window?

    Yes, as long as it is black coffee. Adding cream or sugar triggers an insulin response, which “breaks” the metabolic state the Intermittent Fasting Window Calculator helped you achieve.

    2. What happens if I break my fast early?

    Don’t panic! Simply input your new “finish time” into the calculator for your next meal. Consistency is about the long term, not a single day’s slip-up.

    3. Is the 16:8 window the best for everyone?

    While 16:8 is the most popular, it’s not a one-size-fits-all. Beginners often start with 12:12 or 14:10 to let their bodies adjust before moving to tighter windows.

    Conclusion & CTA

    Mastering your metabolism doesn’t have to be a guessing game. By using an Intermittent Fasting Window Calculator, you take the stress out of the “when” and focus on the “what.” Whether you’re looking to lose weight, improve mental clarity, or simply simplify your life, timing is your greatest tool.

    Ready to take control of your schedule? Try our Intermittent Fasting Window Calculator today and find the perfect rhythm for your body!

  • The Ultimate Pregnancy Due Date Calculator Guide

    The Ultimate Pregnancy Due Date Calculator Guide

    So, you just saw those two life-changing lines on a test? First off, huge congratulations! Once the initial “oh-my-gosh” moment settles, the very next question is almost always: “When do I get to meet my baby?” While the human body doesn’t strictly follow a calendar, a Pregnancy Due Date Calculator is your first essential tool for turning that mystery into a plan. Most parents-to-be feel a mix of excitement and overwhelm, wondering how to track milestones or when to schedule that first doctor’s visit. This guide is designed to take the guesswork out of the equation. We’ll dive into how these calculations work, why your “weeks” might feel a little confusing at first, and how you can use this information to prepare for your new arrival.

    What is a Pregnancy Due Date Calculator and Why it Matters

    A Pregnancy Due Date Calculator is a digital tool used to estimate your Estimated Date of Delivery (EDD). While only about 4% to 5% of babies are actually born exactly on their due date, having an EDD is crucial for several clinical and personal reasons.

    Why Precision Counts

    • Medical Milestone Tracking: Doctors use your due date to ensure the baby is hitting growth targets at the right time.

    • Healthcare Scheduling: Important screenings, like anatomy scans and glucose tests, must happen within specific weekly windows.

    • Personal Preparation: From decorating the nursery to applying for parental leave, having a target month helps you organize your life before the “sleep-deprived” phase begins.

    Understanding your due date isn’t just about the birth; it’s about the 40-week roadmap of pregnancy. Since a typical pregnancy is measured from the first day of your last period (not the day you conceived), the calculator helps bridge the gap between biological timing and the calendar year.

    Step-by-Step Guide: How to Calculate Your Due Date

    Calculating your due date is relatively straightforward if you have the right data. Here is how to use a calculator or do the math yourself:

    • Identify Your LMP: Find the date of the first day of your Last Menstrual Period (LMP). This is the gold standard for most calculators.
    • Determine Cycle Length: If your menstrual cycle is longer or shorter than the average 28 days, adjust the calculation. Most tools allow you to input your average cycle length for better accuracy.
    • Input the Data: Enter your LMP into the calculator tool.
    • Adjust for Conception (Optional): If you happened to be tracking ovulation and know the exact date of conception, some advanced tools allow you to use this for a more “biological” estimate.
    • Review Your Results: The tool will provide your EDD and usually tell you how many weeks and days pregnant you are currently.

    Confirm with Ultrasound: Use the calculated date as a “placeholder” until your first-trimester dating ultrasound, which is the most accurate way to confirm the date.

    The Math Behind It: Naegele’s Rule

    Most Pregnancy Due Date Calculators rely on a formula known as Naegele’s Rule. It sounds technical, but it’s actually a simple piece of arithmetic based on the assumption that a human pregnancy lasts approximately 280 days (40 weeks) from the start of the last period.

    The standard formula is:

    $$LMP + 7\text{ days} – 3\text{ months} + 1\text{ year}$$

    For example, if your last period started on May 1st, 2025:

    1. Add 7 days: May 8th.

    2. Subtract 3 months: February 8th.

    3. Add 1 year (if applicable): February 8th, 2026.

    The Science of “40 Weeks”

    It might seem strange to count the two weeks before you were actually pregnant (the time between your period and ovulation), but because most women don’t know the exact moment of conception, the LMP provides a fixed, reliable starting point for medical professionals worldwide.

    Real-Life Scenarios

    How does this look in practice? Let’s look at a few common situations:

    Scenario A: The Regular Cycle

    Sarah has a consistent 28-day cycle. Her last period began on January 1st. Using the calculator, her due date is set for October 8th. Because her cycle is “textbook,” her doctor likely won’t change this date unless the ultrasound shows a significant size difference.

    Scenario B: The Long Cycle

    Jasmine has a 35-day cycle. If she uses a standard calculator, it might tell her she is due sooner than she actually is. Because she ovulates later than average, her “biological” due date would be roughly one week later than the standard LMP calculation suggests.

    Scenario C: IVF Pregnancy

    For those using In Vitro Fertilization, the “LMP” is irrelevant. Instead, the calculator uses the date of the embryo transfer. If it was a 5-day blastocyst transfer, the math is adjusted to account for the exact age of the embryo.

    FAQs: Frequently Asked Questions

    1. How accurate is a due date calculator?

    It is a very high-quality estimate, but not a guarantee. It assumes a 28-day cycle and that ovulation occurred on day 14. Since every woman’s body is different, your doctor will likely use a “dating scan” (ultrasound) in the first trimester to confirm the date.

    2. Can my due date change during pregnancy?

    Yes. If an early ultrasound shows the baby is significantly larger or smaller than the LMP suggests, your OB-GYN might “correct” your due date to reflect the ultrasound findings, as these are more accurate in the first 12 weeks.

    3. What if I don’t know the date of my last period?

    Don’t panic! This is very common. In this case, your healthcare provider will rely entirely on an ultrasound to measure the crown-rump length (CRL) of the embryo to determine how far along you are.

    Conclusion & CTA

    Finding out your due date is the first step in a beautiful, transformative journey. While the Pregnancy Due Date Calculator gives you a target to aim for, remember that your baby will arrive when they are ready. Use this date to start your countdown, plan your appointments, and begin the exciting process of preparing for your little one.

    Ready to find out your big day? Use our Pregnancy Due Date Calculator now and start planning for your 2026 arrival!

  • Understanding Ideal Body Weight for Army and PAF

    Understanding Ideal Body Weight for Army and PAF

    Stepping into a recruitment center for the Pakistan Army or the Pakistan Air Force (PAF) is a moment of immense pride, but it often comes with a side of “medical screening anxiety.” One of the most common hurdles candidates face isn’t just the initial intelligence test—it’s the weighing scale. Whether you’re aiming for the GD Pilot seat or an infantry commission, your Ideal Body Weight (IBW) is a non-negotiable metric of your physical combat readiness.

    The military doesn’t care about “looking good” in the traditional sense; they care about your power-to-weight ratio, your endurance, and your ability to withstand high G-forces or grueling treks. If you’ve been worried that you’re a few pounds over or under the limit, you’re in the right place. This guide will break down the exact standards, the science behind the numbers, and how you can align your physique with the rigorous requirements of the armed forces.

    What is Ideal Body Weight and Why it Matters

    In the context of the Army and PAF, Ideal Body Weight is a standardized measurement based on your height, age, and gender. Unlike a local gym where “bulking” might be the goal, the military views excess weight as a liability.

    Why the Military is Strict About Weight:

    • Agility and Combat Effectiveness: Carrying extra weight increases the oxygen demand on your muscles. In a high-stakes environment, every extra pound is “dead weight” that slows down your reaction time and endurance.
    • Medical Longevity: The military invests millions in your training. They need officers and airmen who are less prone to joint injuries, cardiovascular issues, and metabolic diseases.
    • The Cockpit Constraint: For PAF candidates, weight is a safety factor. Ejection seats and cockpit dimensions are engineered for specific weight ranges. Being outside those limits could be life-threatening during an emergency.

    • The Discipline Metric: In the eyes of a selection board, maintaining your weight is the first test of your self-discipline and commitment to the uniform.

    Step-by-Step Guide: How to Determine and Reach Your Target Weight

    Calculating your eligibility doesn’t have to be a guessing game. Follow these steps to ensure you meet the medical criteria before your initial or ISSB medical.

    • Step 1: Measure Your Accurate Height: Stand barefoot against a wall. Ensure your heels, buttocks, and back of the head are touching the surface. Mark the top of your head and measure in inches and centimeters.

    • Step 2: Consult the BMI Chart: The Army and PAF primarily use the Body Mass Index (BMI) as an initial screening tool. Generally, a BMI between 18.5 and 24.9 is the “Green Zone.”

    • Step 3: Check the Age-Specific Tables: Requirements relax slightly as you get older. A 17-year-old candidate for the PMA Long Course has stricter weight limits than a 28-year-old candidate for the Short Service Commission.

    • Step 4: Assess Your Body Composition: If you are heavily muscled and the scale says you are “overweight,” the medical board may perform a “waist-to-hip” ratio or skinfold test to ensure it is muscle, not fat.

    • Step 5: Adjust Your Caloric Intake: If you need to lose weight, aim for a deficit of 500 calories per day. If you need to gain, focus on protein-rich surplus.

    • Step 6: Consistent Cardio and Strength Training: Mix running (for endurance) with bodyweight exercises like push-ups and pull-ups to ensure your weight is functional.

    The Math Behind the Military Weight Standard

    The primary formula used by the Pakistan Army and PAF medical boards is the Body Mass Index (BMI), though they often refer to a simplified Height-to-Weight Chart.

    The formula for BMI is:

    $$BMI = \frac{Weight (kg)}{Height (m)^2}$$

    How to calculate it:

    1. Convert your height from inches to meters (e.g., 5’7″ is approx. 1.70m).

    2. Square that number ($1.70 \times 1.70 = 2.89$).

    3. Divide your weight in kilograms by that result.

    The Military Threshold:

    • Underweight: BMI < 18.0 (Likely temporary rejection/T-Unfit)

    • Ideal: BMI 18.5 – 24.5 (Fit)

    • Overweight: BMI 25.0 – 29.9 (Usually given a 3-4 week deadline to lose weight)

    • Obese: BMI > 30.0 (Permanent or serious temporary rejection)

    Real-Life Scenarios: Are You Fit to Join?

    To make this clearer, let’s look at how two different candidates might be assessed during their initial medical exam.

    Scenario A: The Aspiring Pilot (PAF)

    Ahmed is 19 years old and stands 5’9″ (175 cm). His current weight is 82 kg.

    • Calculation: His BMI is approximately 26.8.

    • Verdict: Ahmed is considered “Overweight” by PAF standards. For a GD Pilot, the standards are exceptionally lean. He would likely be marked “Temporary Unfit” and told to return in 30 days after losing 5-7 kg.

    Scenario B: The PMA Long Course Candidate

    Zain is 18 years old and is 5’6″ (167 cm). He weighs 52 kg.

    • Calculation: His BMI is approximately 18.6.

    • Verdict: Zain is right on the edge of the “Underweight” category but falls within the “Fit” range. However, the medical officer might advise him to build more muscle mass to handle the rigors of Kakul Academy.

    Frequently Asked Questions (FAQs)

    1. What happens if I am 2-3 kg over the limit on the medical day?

    In most cases, for the initial medical, the doctors are lenient if you show a fit physique. They may mark you “Fit” but advise you to lose it before ISSB. If you are significantly over, you will be given a “Temporary Unfit” status and a date to reappear.

    2. Does the PAF have different weight rules than the Army?

    Yes. The PAF, especially for the GD (P) branch, is generally stricter. Pilots must fit into specific seat dimensions and handle high G-forces, where excess body fat can impede blood circulation and lead to “G-LOC” (G-induced Loss of Consciousness).

    3. Can I be rejected for being too thin?

    Absolutely. Being underweight (typically a BMI below 17.5 or 18) suggests a lack of physical strength and bone density. The military requires a certain level of “robustness” to carry heavy gear and perform under stress.

    Conclusion & CTA

    Meeting the Ideal Body Weight for the Army or PAF is more than just a box to tick—it is the foundation of your career as a soldier or airman. Your weight is a reflection of your discipline, your health, and your readiness to serve. Don’t wait for the medical officer to tell you that you’re unfit; take control of your fitness today.

    Ready to start your journey? Use the BMI formula provided above to check your current status. If you’re within the range, focus on stamina. If not, start your training regime today!

  • The Ultimate Water Intake Calculator by Weight Guide

    The Ultimate Water Intake Calculator by Weight Guide

    Are you feeling a bit sluggish, dealing with a nagging headache, or noticing your skin looks a little dull? Believe it or not, the solution might be sitting right in your kitchen tap. Most of us know we should “drink more water,” but the old-school advice of eight glasses a day is a bit like wearing a one-size-fits-all hat—it rarely fits perfectly. Your body is unique, and your hydration needs depend heavily on your specific body mass.

    This is where a Water Intake Calculator by Weight becomes your best friend. Instead of guessing, this tool uses your personal data to give you a precise daily target. By tailoring your hydration to your weight, you ensure your cells are fueled, your joints stay lubricated, and your energy levels remain steady. Let’s dive into how this simple calculation can transform your daily wellness routine and keep you performing at your absolute peak.

    What is a Water Intake Calculator by Weight and Why It Matters

    A Water Intake Calculator by Weight is a digital tool designed to determine the specific volume of fluid your body requires to function optimally based on your total body mass. While factors like humidity and activity level play a role, your weight is the primary baseline for metabolic water requirements.

    Why Precision Matters

    Water isn’t just a thirst quencher; it’s the primary conductor for almost every chemical reaction in your body. If you are under-hydrating for your size, you might experience:

    • Cognitive Fog: Even 1-2% dehydration can impair memory and focus.
    • Digestive Issues: Water is essential for processing fiber and moving waste.
    • Metabolic Slowdown: Proper hydration helps your body burn calories more efficiently.


    Using a weight-based approach ensures that a 200-lb athlete and a 120-lb office worker aren’t following the same generic advice. It moves hydration from a “chore” to a personalized health strategy, allowing you to track your progress with scientific accuracy.

    Step-by-Step Guide: How to Calculate Your Daily Needs

    Using a Water Intake Calculator by Weight is straightforward, but knowing how to adjust the numbers for your lifestyle is key. Follow these steps to find your “Magic Number”:

    • Step 1: Determine Your Current Weight: Weigh yourself in the morning for the most accurate baseline.
    • Step 2: Apply the Base Formula: Multiply your weight in pounds by 0.5 to 0.67 (or roughly 30ml to 35ml per kilogram). This gives you your baseline ounces for a sedentary day.
    • Step 3: Account for Physical Activity: For every 30 minutes of intense exercise, add 12 ounces (approx. 350ml) to your total.
    • Step 4: Factor in Your Environment: If you live in a hot or humid climate, increase your total by another 10-15%.
    • Step 5: Divide Into Manageable Goals: Don’t drink it all at once! Divide your total by your waking hours to see how much you need per hour.
    • Step 6: Track and Adjust: Use a reusable bottle with measurements to ensure you’re hitting those marks throughout the day.

    The Math Behind the Hydration

    The science of hydration is rooted in maintaining homeostasis. While it seems complex, the mathematical foundation used by most calculators is actually quite elegant.

    The standard physiological recommendation is often based on the ratio of water to body mass. In the medical community, the formula often used for a healthy adult is:

    $$W_{total} = (Body\,Weight\,in\,kg \times 35ml)$$

    Alternatively, if you prefer the Imperial system, the math looks like this:

    $$Total\,Ounces = Weight\,(lbs) \times 0.5$$

    Why these numbers?

    Our bodies are roughly 60% water. Every day, we lose water through respiration, perspiration, and filtration via the kidneys. The “0.5 oz per pound” rule provides enough volume to replace these losses and maintain the blood’s osmotic pressure. If you are more active, the multiplier moves toward 0.67, accounting for the increased metabolic heat and sweat loss.

    Real-Life Scenarios: Putting the Calculator to Work

    To see how the Water Intake Calculator by Weight functions in the real world, let’s look at three different individuals:

    1. The Sedentary Professional:

      Sarah weighs 140 lbs and spends most of her day at a desk.

      • Calculation: $140 \times 0.5 = 70$ ounces.

      • Goal: Roughly 9 cups of water per day to stay sharp and avoid the “3 PM slump.”

    2. The Active Gym-Goer:

      Mike weighs 200 lbs and does a high-intensity 60-minute workout daily.

      • Base Calculation: $200 \times 0.5 = 100$ ounces.

      • Exercise Adjustment: +24 ounces for 60 mins of sweat.

      • Goal: 124 ounces (nearly a gallon) to support muscle recovery.

    3. The Small-Statured Hiker:

      Elena weighs 110 lbs but is hiking in a dry, high-altitude area.

      • Base Calculation: $110 \times 0.5 = 55$ ounces.

      • Environment/Activity Adjustment: +20 ounces.

      • Goal: 75 ounces to prevent altitude-related dehydration.

    Frequently Asked Questions (FAQs)

    1. Can I drink too much water?

    Yes, it is possible, though rare for healthy individuals. This is called hyponatremia, where sodium levels in the blood become dangerously low. This is why following a Water Intake Calculator by Weight is better than just drinking endless amounts—it gives you a safe upper limit.

    2. Do coffee and tea count toward my goal?

    Surprisingly, yes! While caffeine has a slight diuretic effect, the water in these beverages still contributes to your overall hydration. However, plain water is always the most efficient source for your body to process.

    3. Does my age affect how much water I need?

    Absolutely. As we age, our thirst mechanism becomes less sensitive, and our body’s water composition changes. While weight is the best starting point, older adults should be more proactive about sipping water even when they don’t feel thirsty.

    Conclusion & CTA

    Hydration is the simplest, cheapest, and most effective performance enhancer available. By using a Water Intake Calculator by Weight, you move away from guesswork and toward a data-driven approach to your health. Whether you want more energy, clearer skin, or better workouts, it all starts with that first glass of water.

    Ready to optimize your health? Use our interactive calculator today to find your personalized hydration goal and start your journey to a more energized, hydrated you!

  • Why the SIP Delay Cost Calculator is Your Financial Wake-Up Call

    Why the SIP Delay Cost Calculator is Your Financial Wake-Up Call

    We’ve all been there. You tell yourself, “I’ll start my investment next month once I’ve cleared this credit card bill,” or “I’ll wait until I get that year-end bonus.” It feels like a small, harmless delay. After all, what’s a few months or even a couple of years in the grand scheme of a thirty-year career?

    The truth is, in the world of compounding, time is a much more powerful engine than the amount of money you invest. Delaying your Systematic Investment Plan (SIP) by even six months doesn’t just mean you missed six payments; it means you’ve lopped off the most profitable period of your investment’s life: the final years. The SIP Delay Cost Calculator is a specialized tool designed to show you exactly how much that “next month” is costing you in real dollars. It’s a reality check that quantifies the invisible price of procrastination, helping you bridge the gap between “someday” and “today.”

    What is an SIP Delay Cost Calculator and Why it Matters

    A SIP Delay Cost Calculator is a digital financial tool that compares two investment scenarios: starting your SIP today versus starting it at a later date. By inputting your intended monthly investment, the expected rate of return, and the duration of the delay, the tool calculates the “Opportunity Cost”—the wealth you lose because your money had less time to compound.

    Why It Matters

    The importance of this tool lies in its ability to expose the Power of Compounding. Compounding works exponentially, not linearly. This means the growth you see in Year 25 of an investment is significantly higher than the growth in Year 5. When you delay the start, you aren’t just missing the “early” interest; you are effectively deleting the “peak” interest years at the end of your cycle.

    Using this calculator matters because it shifts your perspective from saving to timing. Many investors wait until they have a “large enough” sum to start, but the SIP Delay Cost Calculator proves that starting small today is almost always better than starting large tomorrow. It provides the motivation needed to maintain discipline and highlights how a small delay of 2–5 years can potentially halve your final retirement corpus.

    Step-by-Step Guide: How to Use the SIP Delay Cost Calculator

    Using the tool is straightforward, but accuracy in your inputs will give you the most realistic “shock to the system.” Follow these steps to see your personal cost of delay:

    • Step 1: Define Your Monthly Contribution

    Enter the amount you plan to invest every month. Whether it’s $100 or $1,000, consistency is the key metric here.

    • Step 2: Set Your Investment Tenure

    Input the total number of years you plan to stay invested (e.g., 20 years until retirement).

    • Step 3: Estimate the Rate of Return

    Enter an expected annual return percentage. For equity-based mutual funds, many investors use a conservative estimate of 10% to 12% based on historical market averages.

    • Step 4: Input the Delay Period

    Specify how long you plan to wait before starting. You can usually toggle this between months or years. Try entering “1 year” just to see the impact.

    • Step 5: Analyze the Comparison

    The calculator will instantly generate two figures:

      1. The Target Wealth if you start today.

      2. The Target Wealth if you start after the delay.

    • Step 6: Review the “Cost of Delay”

      The difference between these two numbers is your cost of delay. This is the amount of wealth you are essentially “paying” for the privilege of waiting.

    The Math Behind the Magic: How It’s Calculated

    The SIP Delay Cost Calculator isn’t just guessing; it uses the standard Future Value (FV) of an Annuity formula. To understand the background science, we look at how interest is earned on both the principal and the accumulated interest over time.

    The formula for a standard SIP (invested at the beginning of the period) is:

    $$FV = P \times \left[ \frac{(1 + r)^n – 1}{r} \right] \times (1 + r)$$

    Where:

    • $P$ = Monthly investment amount.
    • $r$ = Monthly interest rate (Annual Rate / 12 / 100).
    • $n$ = Total number of months ($Years \times 12$).

    The Logic of Delay

    To find the cost of delay, the calculator runs this formula twice.

    1. Scenario A (No Delay): It uses the full $n$ (e.g., 240 months for 20 years).

    2. Scenario B (With Delay): It reduces $n$ by the number of months you delayed (e.g., 228 months if you delayed by one year).

    The “Cost of Delay” is simply $FV_A – FV_B$. The math proves that because $n$ is an exponent, even a small reduction in the value of $n$ leads to a massive drop in the final $FV$, especially as the tenure grows.

    Real-Life Scenarios: Seeing the Impact

    Let’s look at two practical examples to see how these numbers play out in the real world. In both cases, we will assume an expected annual return of 12%.

    Scenario 1: The “Just Five Years” Wait

    • The Goal: Invest $500/month for 25 years.

    • Start Today: Your final corpus would be approximately $948,817.

    • Delay by 5 Years: If you wait 5 years and invest for only 20 years, your corpus drops to $494,865.

    • The Cost: Waiting 5 years cost you $453,952—nearly half your potential wealth!

    Scenario 2: The “One Year” Procrastination

    • The Goal: Invest $1,000/month for 30 years.

    • Start Today: Your final corpus would be approximately $3,529,913.

    • Delay by 1 Year: Your final corpus drops to $3,141,400.

    • The Cost: That “harmless” 12-month delay cost you $388,513. You could have bought a house with the money lost to just one year of waiting.

    FAQs: Frequently Asked Questions

    1. Can I make up for a delay by investing more later?

    Yes, but it is expensive. To reach the same goal as someone who started early, you often have to double or triple your monthly investment. The calculator can help you find the “Step-up” amount needed to bridge that gap.

    2. Is the SIP Delay Cost Calculator accurate for all markets?

    The calculator uses a fixed rate of return for projection purposes. While real-market returns fluctuate, the principle remains the same: more time in the market beats trying to “time” the market.

    3. Does the cost of delay include inflation?

    Most basic calculators do not account for inflation. However, if you want a more realistic view, you can subtract the inflation rate (e.g., 5%) from your expected return (e.g., 12%) and enter 7% as your return rate in the tool.

    Conclusion & CTA

    The numbers don’t lie: time is the most valuable asset in your portfolio. As the SIP Delay Cost Calculator demonstrates, every month you spend on the sidelines is a month of compounding you can never get back. Don’t let the search for the “perfect” fund or the “perfect” time stop you from building your future.

    Ready to see what your “someday” is costing you? Use our tool today to calculate your specific delay cost and take the first step toward financial freedom. Start your SIP now—your future self will thank you.

    Know more: Smartcalc……….