Category: Finance, Business & Tech

  • Why You Need a Domain Age Calculator Today

    Why You Need a Domain Age Calculator Today

    Starting a new SEO project can feel like being the new kid at a high school where everyone already has their cliques and reputations. You’re staring at a competitor who seems to rank effortlessly for every keyword, and you’re wondering, “What do they have that I don’t?” More often than not, the answer is time. In the world of search engines, time translates to “Domain Age,” a critical factor that acts as a digital credit score for your website.

    Understanding the age of a domain isn’t just about satisfying your curiosity; it’s about strategic intelligence. Whether you are looking to purchase a premium expired domain to jumpstart your growth or analyzing why a competitor dominates the SERPs, a Domain Age Calculator is your most essential diagnostic tool. It strips away the mystery, showing you exactly how long a site has been building its “trust” with Google. Let’s dive into why this metric is the backbone of veteran SEO strategies and how you can use it to gain a competitive edge.

    What is a Domain Age Calculator and Why it Matters

    A Domain Age Calculator is a specialized SEO tool that identifies the exact date a domain name was first registered and how long it has existed. While it sounds simple, the implications for your SEO strategy are massive. Think of a domain like a fine wine or a professional reputation—it generally gets better and more trusted as it gets older.

    Why It Matters for SEO

    Search engines, particularly Google, place a high value on E-E-A-T (Experience, Expertise, Authoritativeness, and Trustworthiness). A domain that has been active for ten years without any “black hat” penalties is seen as much more reliable than a domain registered yesterday. New domains are often subject to the “Google Sandbox,” a period where the search engine cautiously observes the site before letting it rank for competitive terms.

    By using a Domain Age Calculator, you can:

    • Vet Potential Purchases: Ensure an “aged” domain isn’t just a month old.

    • Analyze Competitors: Determine if a rival is winning because of better content or simply because they’ve been around since 2005.

    • Audit Backlinks: Check the age of sites linking to you; links from older, established domains carry significantly more “link juice.”

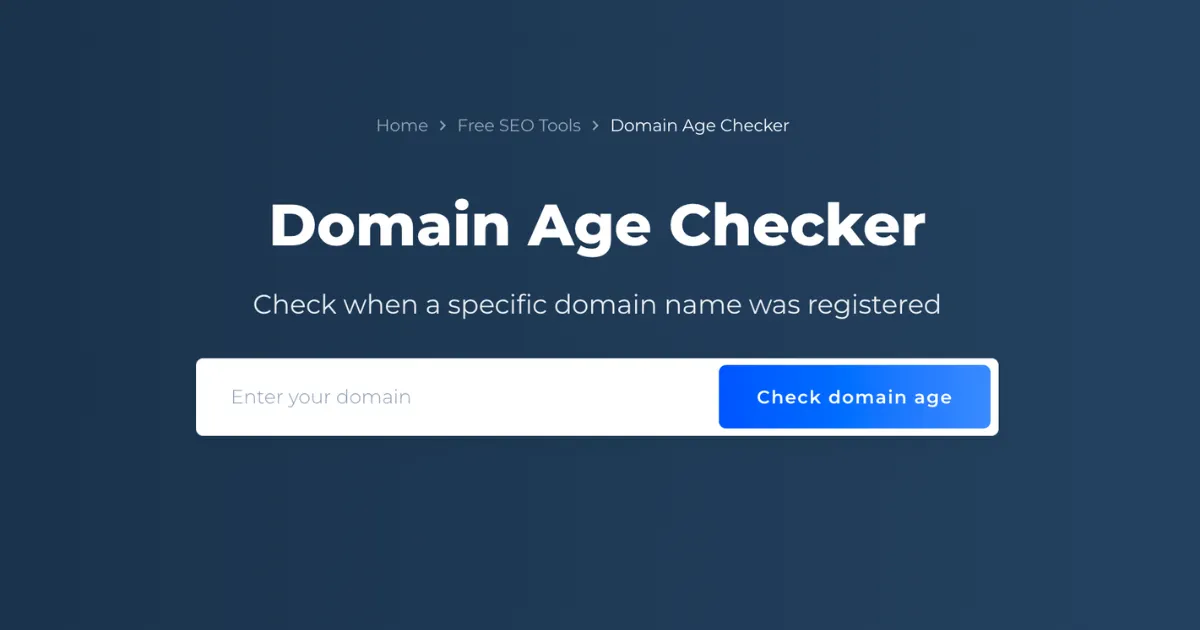
    Step-by-Step Guide: How to Use a Domain Age Calculator

    Using this tool is straightforward, but interpreting the data like a pro is where the real value lies. Follow these steps to get the most out of your analysis:

    • Step 1: Input the URL: Copy the full domain address (e.g., example.com) into the tool’s search bar. You don’t usually need the https:// prefix.

    • Step 2: Run the Check: Click the “Check Domain Age” button. The tool will query the WHOIS database and historical archives.

    • Step 3: Review the Registration Date: Look for the “Created Date.” This tells you when the domain was first born.

    • Step 4: Check the Expiry and Update Dates: A domain that is renewed for multiple years into the future often signals to search engines that the owner is serious and not a “fly-by-night” spammer.

    • Step 5: Verify via Wayback Machine: If the tool provides a link to the Internet Archive, use it. A domain might be 10 years old, but if it was “parked” or empty for 9 of those years, it won’t have the same SEO power as a site that was consistently active.

    • Step 6: Export for Comparison: If you are doing competitor research, log the ages of the top 10 ranking sites in a spreadsheet to find the “average age” required to rank for your target keyword.

    The Math and Logic Behind Domain Authority

    While there isn’t a single “multiplication formula” that Google uses, the logic behind domain age is rooted in Probability and Decay Models. Search engines use historical data to calculate the likelihood that a website is a high-quality resource versus a spam site.

    In technical terms, we can look at the relationship between Age ($A$) and Trust ($T$) as a non-linear growth function. In the early stages, the “Trust” grows slowly (the Sandbox effect), but as the site persists without violations, the growth curve steepens.

    $$T \approx \log(A) + B$$

    In this simplified model, $T$ represents the Trust score, $A$ is the Age in years, and $B$ represents the “Backlink Profile” quality. As $A$ increases, the logarithmic growth ensures that while an older site has an advantage, a younger site can eventually catch up if its Backlink Profile ($B$) is significantly superior. The math tells us that consistency + time = authority.

    Real-Life Scenarios: Putting the Tool to Work

    Scenario 1: The “Aged Domain” Investment

    Sarah is looking to start a tech blog. She finds a domain for sale called TechPioneer.com that claims to be 15 years old for $500. She uses the Domain Age Calculator and discovers the domain was actually dropped and re-registered only 6 months ago. The tool saves her $500 by revealing that the “SEO age” was reset, and the domain is effectively a newborn.

    Scenario 2: Competitive Analysis

    A local bakery, “Sweet Treats,” is frustrated that “Grandma’s Oven” always ranks #1. Using the calculator, the owner sees that “Grandma’s Oven” was registered in 1998, while “Sweet Treats” started in 2023. This realization changes their strategy: instead of trying to out-rank them on “age,” they focus on “freshness” and local social media signals to bypass the age gap.

    Scenario 3: Link Building Outreach

    You receive a guest post offer from a site that looks polished. You run it through the calculator and see the domain is only 30 days old. You realize they are likely a “link farm” and decline the offer to protect your site from a potential Google penalty.

    FAQs: Everything You Need to Know

    1. Does a domain’s age reset if I buy it?

    If the domain registration never expires and is simply transferred, the age usually stays intact. However, if a domain expires and “drops” back to the registry before you buy it, the age (and SEO authority) often resets to zero.

    2. Is a 10-year-old domain always better than a 1-year-old one?

    Not necessarily. A 1-year-old domain with high-quality content and powerful backlinks can outrank a 10-year-old domain that has been neglected, contains thin content, or has a “toxic” link profile. Age is a “booster,” not a guarantee.

    3. Can I hide my domain’s age from calculators?

    While you can use “WHOIS Privacy” to hide your personal contact details, the actual registration, update, and expiry dates of a domain are public record and cannot be hidden from SEO tools.

    Conclusion & CTA

    Domain age is the “silent partner” in your SEO strategy. It provides the foundation of trust that allows your content and keywords to truly shine. By using a Domain Age Calculator, you stop guessing and start making data-driven decisions about your competition and your digital investments.

    Ready to see where you stand? Use our professional Domain Age Calculator now to audit your site and see how much “authority equity” you’ve built over the years!

  • Why Your Password is Probably Weak: The Ultimate Guide to Password Entropy

    Why Your Password is Probably Weak: The Ultimate Guide to Password Entropy

    If you’ve ever been told your password needs an uppercase letter, a number, and a special character, you’ve felt the frustration of modern security. But here is the secret: those arbitrary rules don’t actually make your password “strong”—entropy does.

    Welcome to the world of Password Entropy, the scientific way to measure how hard it is for a computer to guess your secret. Whether you are protecting your bank account or your gaming profile, understanding the math behind your password is the difference between staying safe and getting hacked in seconds. Most people treat passwords like a chore, but with a Password Entropy Calculator, you can turn digital security into a precise science. This guide will walk you through why your current “P@ssword123” is a disaster and how to build an unbreakable digital fortress.

    What is Password Entropy and Why It Matters

    In simple terms, Password Entropy is a measurement of how unpredictable a password is. Think of it like a deck of cards; the more you shuffle it and the more cards you add, the harder it is for someone to guess the exact order of the deck.

    In the world of cybersecurity, entropy is measured in bits. The higher the bit count, the more attempts a hacker’s “brute-force” software must make to crack it.

    Why It Matters

    Most hackers don’t sit in a dark room guessing your pet’s name. They use powerful computers that can try billions of combinations per second.

    • Predictability is the Enemy: If you use common words or short strings, entropy is low, and the “search space” for a hacker is small.
    • Time is Money: High entropy increases the time required to crack a password from milliseconds to millions of years.
    • Quality over Complexity: It’s not just about using weird symbols; it’s about length and the variety of characters used (the character set).
    • Using a calculator allows you to visualize this invisible strength, moving beyond guesswork to data-backed security.
    • Step-by-Step Guide: How to Use a Password Entropy Calculator
    • Ready to test your strength? Follow these steps to evaluate your passwords and generate better ones.
    • Step 1: Select Your Character Set

      Before typing, identify what you are using. Are you only using lowercase letters (26 possibilities)? Or are you including uppercase, numbers, and symbols (95+ possibilities)?

    • Step 2: Enter Your Password (Carefully)

      Type your password into the calculator. Pro Tip: Never enter your actual live passwords into an untrusted website. Use a variation that follows the same pattern to test the logic.

    • Step 3: Analyze the Bit Score

      The tool will output a number in bits. Here is how to read the results:

      • < 40 bits: Very Weak (Cracked instantly).

      • 40–60 bits: Weak (Cracked in days/weeks).

      • 60–80 bits: Strong (Safe for most personal accounts).

      • 128+ bits: Ultra-Secure (The gold standard).

    • Step 4: Adjust and Re-Test

      If your score is low, try adding length rather than just symbols. Notice how adding three random letters often increases entropy more than changing an “s” to an “$”.

    • Step 5: Apply to Your Password Manager

      Once you find a pattern that yields high entropy, use it to update your primary accounts.

    • The Math Behind the Strength: The Entropy Formula
    • You don’t need a PhD in mathematics to understand how this works, but seeing the formula helps you realize why length is king.
    • The standard formula for password entropy is:
    • $$E = L \times \log_2(R)$$
    • Where:
    • $E$ is the information entropy in bits.
    • $L$ is the length of the password (number of characters).
    • $R$ is the size of the pool of characters you are choosing from (the range).
    • Why Length Wins
    • The “Range” ($R$) is logarithmic, while the “Length” ($L$) is a linear multiplier. This means that doubling the length of your password is exponentially more effective than doubling the complexity of the characters used.
    • For example, a 20-character password made of only lowercase letters is often much stronger than an 8-character password filled with complex symbols. This is why “passphrases” (long strings of random words) are the modern standard for security.
    • Real-Life Scenarios: Entropy in Action
    • Let’s look at how this math translates to the real world.
    • Scenario 1: The “Complex” Short Password
    • Password: P@ss12

    • Entropy: ~28 bits.

    • Outcome: Even though it has a capital letter, a symbol, and numbers, a modern GPU can crack this in less than a second. It feels “strong” to a human but is “transparent” to a machine.

    • Scenario 2: The “Simple” Passphrase
    • Password: correct-horse-battery-staple

    • Entropy: ~100+ bits.

    • Outcome: Because it is long and uses a wide range of characters (including hyphens), it would take a supercomputer decades to guess this by brute force.

    • Scenario 3: The Randomly Generated Key
    • Password: 4f9*K!zL29vQ

    • Entropy: ~75 bits.

    • Outcome: This is a very strong password for a banking app. It’s hard to memorize, which is why we recommend using a password manager to store high-entropy strings like this.

    • Frequently Asked Questions (FAQs)
    • 1. Is a 12-character password enough?
    • Generally, yes, provided it is truly random. A 12-character password with mixed cases, numbers, and symbols usually provides about 72 bits of entropy, which is currently considered “strong” for most online services.
    • 2. Why is length more important than special characters?
    • Because of the way the math works. Adding one extra character to your password length increases the total possible combinations much more drastically than simply swapping a letter for a similar-looking symbol (like ‘a’ for ‘@’).
    • 3. Do spaces count toward entropy?
    • Absolutely! If a system allows spaces, they act as another character in your “Range” ($R$). Using spaces in a long passphrase is an excellent way to boost entropy while keeping the password easy for you to remember.
    • Conclusion: Take Control of Your Security
    • Understanding password entropy takes the mystery out of cybersecurity. It’s not about following annoying rules; it’s about making the “search space” so large that a hacker’s computer would have to run until the end of time to find your key.
    • Stop guessing and start measuring. Use our Password Entropy Calculator today to audit your most important accounts. If your score is below 60 bits, it’s time for an upgrade!
  • Master the Squeeze: The Ultimate Video File Size Compressor Estimator Guide

    Master the Squeeze: The Ultimate Video File Size Compressor Estimator Guide

    Have you ever tried to send a high-quality video over email or upload a 4K masterpiece to social media, only to be met with the dreaded “File size too large” error? It is one of the most frustrating digital roadblocks today. As we move toward higher resolutions like 1080p and 4K, our video files are ballooning into gigabytes, making them nearly impossible to share or store efficiently.

    This is where a Video File Size Compressor Estimator becomes your digital best friend. Instead of playing a guessing game with your export settings—hoping the final file lands under the 25MB email limit—this tool allows you to predict the outcome before you even hit “Render.” In this guide, we’ll dive deep into how video compression works, the math that governs your file sizes, and how you can use an estimator to save time, storage, and sanity.

    What is a Video File Size Compressor Estimator and Why it Matters

    At its core, a Video File Size Compressor Estimator is a predictive tool used by creators, editors, and everyday users to determine how large a video file will be after it has been compressed. It calculates the final “weight” of your media based on variables like duration, resolution, and the most critical factor: Bitrate.

    Why Does it Matter?

    • In an era where “content is king,” the efficiency of that content is just as vital. Understanding your expected file size is crucial for several reasons:
    • Bandwidth Management: If you are a streamer or a web developer, knowing the file size helps you ensure your audience can play videos without constant buffering.
    • Storage Optimization: Whether you’re using a smartphone or a professional server, space is a finite resource. Estimating sizes helps you plan your cloud storage needs.
    • Workflow Efficiency: Professionals don’t want to wait three hours for a 10GB export only to realize it needs to be 2GB. An estimator provides the “blueprint” before the work begins.
    • Platform Compliance: Most platforms have strict limits (e.g., Discord’s 25MB or WhatsApp’s 2GB). Estimating ensures you hit those targets on the first try.

    Step-by-Step Guide: How to Estimate and Compress Your Video

    Using a compressor estimator is straightforward once you know which numbers to look for. Follow these steps to get an accurate prediction:

    1. Identify Your Video Duration: Note the exact length of your video in seconds. (e.g., a 2-minute video is 120 seconds).
    2. Determine Your Target Quality (Resolution): Decide if you need 4K (3840×2160), 1080p (1920×1080), or 720p (1280×720). Higher resolution doesn’t always mean a bigger file—the bitrate does—but higher resolutions require higher bitrates to look good.
    3. Choose a Target Bitrate: This is the “speed” of data. For a clear 1080p video, 5 Mbps (Megabits per second) is a standard target. For 4K, you might look at 20-30 Mbps.
    4. Input Data into the Estimator: Plug your duration and target bitrate into your estimator tool.
    5. Calculate and Convert: The tool will likely give you a result in Megabits ($Mb$). Since we measure storage in Megabytes ($MB$), you must divide the result by 8.
    6. Adjust Settings in Your Compressor: Open your compression software (like HandBrake or Adobe Media Encoder) and set the “Target Bitrate” to match the one you used in your estimate.
    7. Final Export: Hit start! Your final file should be within 5-10% of your estimated size.

    The Math Behind the Squeeze: The Formula

    The secret to video file size isn’t magic; it’s a simple mathematical relationship between time and data flow. The primary formula used by any professional estimator is:

    $$\text{File Size} = \frac{\text{Bitrate (Mbps)} \times \text{Duration (seconds)}}{8}$$

    Why “8”?

    This is where many people get confused. Data “speed” (bitrate) is measured in bits (lowercase ‘b’), but storage is measured in Bytes (uppercase ‘B’). There are exactly 8 bits in 1 Byte. Therefore, if your video has a bitrate of 8 Mbps, it consumes 1 Megabyte of storage every second.

    The Codec Factor

    While the formula provides a “raw” estimate, the Codec (like H.264 or H.265/HEVC) acts as a multiplier of efficiency.

    • H.264: The standard. Reliable but less efficient.
    • H.265 (HEVC): The modern pro. It can often provide the same visual quality as H.264 at half the bitrate. This means you can cut your file size in half just by switching the codec!

    Real-Life Scenarios: Putting Estimation into Practice

    To help you visualize how this works, let’s look at three common scenarios users face:

    Scenario 1: The Social Media Creator

    Goal: Upload a 60-second “Short” or “Reel” in 1080p.

    • Target Bitrate: 6 Mbps (High quality for mobile).

    • Calculation: $(6 \text{ Mbps} \times 60 \text{ seconds}) / 8 = 45 \text{ MB}$.

    • Result: This file is perfect for a quick upload without losing sharpness.

    Scenario 2: The Webinar Archiver

    Goal: Save a 1-hour (3600 seconds) Zoom presentation for internal review.

    • Target Bitrate: 2 Mbps (Low motion content doesn’t need much data).

    • Calculation: $(2 \text{ Mbps} \times 3600 \text{ seconds}) / 8 = 900 \text{ MB}$.

    • Result: You’ve kept a full hour under 1GB, saving massive amounts of cloud storage.

    Scenario 3: The 4K Filmmaker

    Goal: Export a 10-minute (600 seconds) 4K cinematic travel vlog.

    • Target Bitrate: 40 Mbps (To preserve high detail).

    • Calculation: $(40 \text{ Mbps} \times 600 \text{ seconds}) / 8 = 3,000 \text{ MB (or 3GB)}$.

    • Result: You know exactly how much space you need on your thumb drive before you leave the studio.

    Frequently Asked Questions (FAQs)

    1. Does reducing the resolution always reduce the file size?

    Not necessarily. File size is determined by bitrate × duration. You can have a 4K video with a very low bitrate that is smaller than a 720p video with a very high bitrate. However, 4K usually requires a higher bitrate to avoid looking blurry or “pixelated.”

    2. What is the difference between CBR and VBR?

    CBR (Constant Bitrate) maintains the same data rate throughout the video, making file size prediction 100% accurate. VBR (Variable Bitrate) lowers the data during simple scenes (like a black screen) and increases it during complex ones (like an explosion). VBR is more efficient but makes the final size harder to estimate exactly.

    3. Which codec should I use for the smallest file size?

    Currently, H.265 (HEVC) or AV1 are the best choices. They use advanced algorithms to find “redundant” pixels, allowing them to shrink files significantly more than the older H.264 standard while keeping the image crisp.

    Conclusion & CTA

    Understanding how to estimate your video file size is the difference between a seamless digital workflow and hours of wasted time. By mastering the relationship between bitrate and duration, you take full control of your media.

    Stop guessing and start calculating! Use our Video File Size Compressor Estimator today to perfectly size your next project for any platform.

  • YouTube Money Calculator: Estimate Your Earnings with Regional CPM

    YouTube Money Calculator: Estimate Your Earnings with Regional CPM

    Ever wondered why a YouTuber with a million views might be struggling to pay rent while another with just 50,000 views is buying a new Tesla? The secret isn’t just “luck”—it’s the math of Regional CPM.

    If you’re a creator, understanding how much your content is actually worth in different parts of the world is the difference between a hobby and a high-paying career. Our YouTube Money Calculator is designed to strip away the mystery, helping you forecast your revenue based on where your audience lives and what they’re watching. Whether you’re targeting viewers in New York or New Delhi, this tool gives you the hard data you need to strategize like a pro.

    What is a YouTube Money Calculator and Why it Matters

    A YouTube Money Calculator is an analytical tool that estimates potential ad revenue for a channel or specific video. Unlike a simple “views-to-dollars” converter, a professional-grade calculator accounts for CPM (Cost Per Mille) and RPM (Revenue Per Mille).

    Why Regional CPM is the Real King

    CPM is what advertisers pay for every 1,000 ad impressions. However, this rate isn’t universal. Advertisers in “Tier 1” countries (like the USA, Australia, or Norway) have much higher budgets than those in “Tier 3” countries.

    • Purchasing Power: Advertisers pay more to reach viewers who have more disposable income.
    • Market Competition: In highly developed digital markets, more brands are bidding for the same ad spots, driving prices up.
    • Niche Relevancy: A tech review watched in Switzerland might generate a $20 CPM, while the exact same video watched in a lower-CPM region might only generate $2.

    Using a calculator allows you to see these discrepancies clearly. It helps you decide if you should pivot your content to a more lucrative audience or if your current “low” earnings are actually standard for your specific demographic.

    Step-by-Step Guide: How to Use the YouTube Money Calculator

    Estimating your take-home pay doesn’t require a degree in finance. Follow these steps to get an accurate projection:

    • Step 1: Input Your Daily or Monthly Views Enter the average number of views your channel receives. Be realistic—use your “Last 28 Days” average from YouTube Analytics for the most accurate results.
    • Step 2: Select Your Primary Audience Region This is where the “Regional” part matters. Select the country where the majority of your viewers reside. If your audience is split, run the calculation for your top three countries separately to see the range.
    • Step 3: Choose Your Content Niche Select your category (e.g., Finance, Gaming, Education). High-intent niches like Finance or B2B typically command 5x higher CPMs than general Entertainment.
    • Step 4: Adjust the Monetization Rate Not every view shows an ad. On average, only 40% to 60% of views are “monetized” due to ad blockers or viewers skipping ads. Adjust this slider based on your channel’s history.
    • Step 5: Review the Estimates The tool will provide a Daily, Monthly, and Yearly breakdown. It will also show you the difference between the Gross Revenue (what advertisers pay) and your Net Earnings (what actually hits your bank account).

    The Math Behind the Money: The Formula Explained

    To understand the calculator’s output, you need to understand the relationship between CPM and your actual paycheck. YouTube famously takes a 45% cut of ad revenue, leaving you with 55%.

    The core formula for your estimated earnings is:

    $$\text{Estimated Earnings} = \left( \frac{\text{Total Views}}{1,000} \right) \times \text{CPM} \times \text{Monetization Rate} \times 0.55$$

    In 2026, we also look at RPM (Revenue Per Mille), which is a cleaner metric for creators because it already accounts for YouTube’s cut and non-monetized views.

    $$\text{RPM} = \left( \frac{\text{Total Earned Revenue}}{\text{Total Views}} \right) \times 1,000$$

    If your calculator shows a CPM of $10.00 and you have a 50% monetization rate, your effective RPM would be approximately $2.75. This is why “million-view” videos can vary so wildly in payouts.

    Real-Life Scenarios: High CPM vs. Low CPM

    To see the impact of geography and niche, let’s look at two hypothetical creators:

    Scenario 1: The US-Based Finance Guru

    • Niche: Crypto & Investing

    • Region: United States (High CPM: $30.00)

    • Views: 100,000 per month

    • Estimated Earnings: At a $15.00 RPM (post-cut), this creator earns $1,500/month.

    Scenario 2: The Global Gaming Streamer

    • Niche: Minecraft Gameplay

    • Region: India/Southeast Asia (Lower CPM: $3.00)

    • Views: 1,000,000 per month (10x more views than Scenario 1!)

    • Estimated Earnings: At a $1.20 RPM, this creator earns $1,200/month.

    The Lesson: Even with 10 times the audience, the gaming creator earns less because of the regional and niche-based ad value. This is why “chasing views” isn’t always as profitable as “chasing the right audience.”

    FAQs: Top 3 Questions About YouTube Earnings

    1. Why is my actual payout lower than the calculator’s estimate? The most common reason is the Monetization Rate. If a large portion of your audience uses ad blockers or watches on platforms where ads aren’t served, your “Monetized Playbacks” will be much lower than your total “Views.”

    2. Which countries have the highest YouTube CPM in 2026? Currently, Norway, Switzerland, the United States, Australia, and Canada lead the charts. These regions have high advertiser competition and strong consumer purchasing power.

    3. Does video length affect my CPM? Yes! Videos longer than 8 minutes allow for mid-roll ads. This effectively increases your “Ad Impressions” per view, which can significantly boost your total revenue even if the base CPM remains the same.

    Conclusion & CTA

    Success on YouTube is a blend of creativity and data. By using the YouTube Money Calculator (Regional CPM), you stop guessing and start planning. Knowing the value of your audience allows you to negotiate better sponsorships, choose more profitable video topics, and set realistic financial goals.

    Ready to see what your channel is worth? Use our calculator today to analyze your potential and start optimizing your content for the highest-paying regions!

  • The Ultimate Instagram Engagement Rate Calculator Guide

    The Ultimate Instagram Engagement Rate Calculator Guide

    Are your Instagram posts being met with a wall of silence? You aren’t alone. In 2026, the “Follower Count” is officially a vanity metric. Brands, influencers, and savvy creators have shifted their focus to a much more telling number: the engagement rate. While your follower count tells the world how many people could see your content, your engagement rate reveals how many people actually care about it.

    An Instagram Engagement Rate Calculator is the secret weapon you need to bridge the gap between posting into the void and building a thriving community. Instead of manually scrolling through hundreds of posts to count “likes,” this tool does the heavy lifting for you, providing a percentage that reflects the true health of your account. In this guide, we’ll dive into why this metric is the king of 2026 social media and how you can use it to skyrocket your growth.

    What is an Instagram Engagement Rate Calculator and Why it Matters

    An Instagram Engagement Rate Calculator is a digital tool designed to measure the level of interaction your content receives relative to your audience size. It aggregates “signals” like likes, comments, shares, and saves, then compares them against your total followers (or reach) to produce a percentage.

    Why it Matters in 2026

    • Quality Over Quantity: Having 100,000 followers means nothing if only 10 people interact. A high engagement rate proves your audience is real and attentive.
    • The Algorithm Secret: Instagram’s 2026 algorithm prioritizes content that generates “meaningful social interactions.” High engagement signals to the platform that your post is worth showing to a broader audience on the Explore page.
    • Brand Partnership Power: Brands no longer hire influencers based on follower counts. They look for “conversion potential.” A creator with 10,000 followers and a 5% engagement rate is often more valuable than a creator with 100,000 followers and a 0.5% rate.
    • Content Direction: By tracking this metric, you can identify exactly which posts resonate (e.g., Reels vs. Carousels) and stop wasting time on content that falls flat.

    Step-by-Step Guide: How to Use an Engagement Calculator

    Using an automated tool is the fastest way to get results, but you can also do it manually for specific posts. Here is how to use the tool effectively:

    • Step 1: Enter the Username: Input the public Instagram handle you want to analyze. Ensure the account is not set to “Private,” as tools cannot fetch data from restricted profiles.
    • Step 2: Select the Data Range: Most modern calculators allow you to choose between your “Last 10 Posts,” “Last 30 Days,” or a specific date range. For the most accurate “current” health check, choose the last 12–15 posts.
    • Step 3: Analyze the Breakdown: Don’t just look at the final percentage. Look at the ratio of Likes to Comments. In 2026, shares and saves carry more weight in the algorithm than a simple “like.”

    • Step 4: Compare Against Industry Benchmarks: Once you have your number (e.g., 2.5%), compare it to the average for your niche. For example, Higher Education and Sports accounts typically see higher rates than Tech or B2B.
    • Step 5: Export and Track: Save your results in a CSV or PDF. Tracking this weekly allows you to see if your new content strategy is actually moving the needle.

    The Math/Formula Behind It

    While the tool automates the process, understanding the “why” behind the numbers helps you strategize. There are two primary ways to calculate engagement, but the Engagement Rate by Followers (ER) is the industry standard for public benchmarking.

    The Standard Formula

    The basic calculation used by most tools is:

    $$ER = \left( \frac{\text{Total Engagements}}{\text{Total Followers}} \right) \times 100$$

    Breaking Down “Total Engagements”

    In the 2026 landscape, “Total Engagements” is usually defined as the sum of:

    • Likes

    • Comments

    • Shares

    • Saves

    Example:

    If you have 5,000 followers and your latest post receives 150 likes, 20 comments, 15 shares, and 15 saves, your total engagement is 200.

    $$ER = \left( \frac{200}{5,000} \right) \times 100 = 4\%$$

    A 4% engagement rate is considered very healthy for a micro-influencer!

    Real-Life Scenarios

    Scenario 1: The “Vanity” Account

    Imagine an account with 1,000,000 followers. On their latest post, they receive 1,000 likes and 50 comments.

    • Calculation: $(1,050 / 1,000,000) \times 100 = 0.105\%$.

    • Outcome: This is a major red flag for brands. It suggests the followers might be “ghost” accounts or that the content is no longer relevant to the audience.

    Scenario 2: The Rising Micro-Influencer

    A local fitness coach has 8,000 followers. They post a high-value Reel that gets 400 likes, 60 comments, and 100 saves.

    • Calculation: $(560 / 8,000) \times 100 = 7\%$.

    • Outcome: This creator has a “super-fan” base. Brands would be eager to partner with them because their audience is highly likely to take action on recommendations.

    FAQs: Frequently Asked Questions

    1. What is a “good” engagement rate on Instagram in 2026?

    While it varies by industry, a rate between 1.5% and 3.5% is generally considered good. Nano-influencers (under 10k followers) often see higher rates (5%+), while massive celebrity accounts may hover around 1%.

    2. Does the tool include “Story” views in the calculation?

    Most public calculators can only track “Feed” interactions (Posts, Reels, Carousels) because Story data is private. To calculate Story engagement, you’ll need to use your internal Instagram Insights and divide “Interactions” by “Reach.”

    3. Why is my engagement rate dropping even though I’m gaining followers?

    This is a common phenomenon called “Follower Drag.” As your audience grows, it becomes harder to keep every single person engaged. To counter this, focus on interactive content like polls, Q&As, and high-shareable Reels.

    Conclusion & CTA

    Your Instagram success isn’t defined by the size of your crowd, but by the intensity of their applause. Using an Instagram Engagement Rate Calculator gives you the clarity to stop guessing and start growing. By monitoring your “Real” influence, you can refine your voice, attract better brand deals, and truly dominate the platform.

    Ready to see where you stand? Use our free tool today to calculate your engagement rate and take the first step toward a data-driven social media strategy!

  • Why You Need a Child Education Inflation Calculator Today

    Why You Need a Child Education Inflation Calculator Today

    Planning for your child’s future is perhaps the most significant financial journey you will ever undertake. We all dream of seeing our children walk across the stage at a prestigious university, but there is a silent “thief” that often goes unnoticed until it’s too late: Education Inflation. While general inflation (the cost of groceries or fuel) might hover around 3% to 5%, the cost of higher education globally has historically climbed at a much faster rate—often between 8% and 12% annually.

    A Child Education Inflation Calculator is not just a digital tool; it is a reality check. It bridges the gap between what a degree costs today and what it will actually cost when your child is ready to enroll. By using this tool, you stop guessing and start strategizing. It transforms an overwhelming “eventual” expense into a manageable, structured monthly goal, ensuring that when the time comes, your child chooses their college based on their dreams, not your bank balance.

    What is a Child Education Inflation Calculator and Why it Matters

    At its core, a Child Education Inflation Calculator is a financial planning tool designed to estimate the future cost of schooling or university by accounting for the annual rise in tuition and living expenses. Unlike a simple savings calculator, this tool acknowledges that $10,000 today will not buy the same amount of education 10 or 15 years from now.

    Why It Matters

    • The “Double Inflation” Effect: Education costs typically outpace the Consumer Price Index (CPI). If you only save based on today’s prices, you might find yourself 40% to 50% short of the required funds.

    • Compounding Time: The calculator helps you realize the “cost of waiting.” Starting just three years late can nearly double the monthly investment required to reach the same goal.

    • Holistic Planning: Most calculators don’t just look at tuition. They help you factor in books, specialized equipment, and the rising cost of housing, providing a 360-degree view of the financial commitment.

    • Curated Investment Strategy: Once you know the “Inflation-Adjusted” target, you can choose investment vehicles (like stocks or mutual funds) that have a historical track record of beating inflation, rather than relying on low-interest savings accounts that might actually lose value in real terms.

    Step-by-Step Guide: How to Use the Calculator

    Using the tool is straightforward, but accuracy in your inputs will lead to a much more reliable financial roadmap. Follow these steps to get your personalized education target:

    • Step 1: Determine the “Current Cost”: Research the total cost of the degree or school you envision for your child as it stands today. Include tuition, admin fees, and room/board.
    • Step 2: Input Your Child’s Age: The tool needs to know the “Years to Goal.” If your child is 3 and starts university at 18, you have a 15-year window.
    • Step 3: Set the Inflation Rate: Be realistic. While 6% is a common baseline, many experts recommend using 10% for professional courses like Engineering or Medicine to stay on the safe side.

    • Step 4: Enter Current Savings: If you have already set aside a lump sum for their education, input it here. The calculator will grow this amount alongside your future contributions.
    • Step 5: Define Expected Returns: Estimate how much your investments will earn. Typically, equity-heavy portfolios might aim for 10-12%, while conservative debt portfolios might see 6-8%.
    • Step 6: Calculate and Review: Hit the “Calculate” button. The tool will display the Future Value (the scary high number) and the Monthly Investment Required to get there.

    The Math Behind the Calculator

    You don’t need a Ph.D. in finance to understand how the calculator works. It primarily uses the Future Value (FV) formula, which is a variation of the compound interest formula.

    The core equation used is:

    $$FV = PV \times (1 + r)^n$$

    Where:

    • $FV$ is the Future Value (the cost of education when your child starts).

    • $PV$ is the Present Value (the cost of the course today).
    • $r$ is the annual inflation rate (expressed as a decimal, e.g., 0.10 for 10%).
    • $n$ is the number of years until the child starts their education.

    In simple terms: Every year, the calculator takes the previous year’s cost and adds the inflation percentage to it, compounding that increase year after year. This is why the final number often looks much larger than people expect—compounding works for costs just as it does for savings!

    Real-Life Scenarios

    To see the Child Education Inflation Calculator in action, let’s look at two common examples.

    Scenario A: The Local Engineering Degree

    • Current Cost: $40,000 (Total for 4 years)

    • Child’s Age: 5 years old (13 years until University)

    • Assumed Inflation: 8%

    • The Result: In 13 years, that same degree will cost approximately $108,785. If the parent has $0 saved today, they would need to invest roughly $430 per month (assuming 10% investment returns) to meet this goal.

    Scenario B: The International Medical School

    • Current Cost: $150,000 (Total)

    • Child’s Age: Newborn (18 years until University)

    • Assumed Inflation: 6%

    • The Result: By the time the baby is ready for med school, the cost will have ballooned to $428,150. While the number is large, starting early allows the parent to utilize the “Power of Compounding” to build that corpus over nearly two decades.

    FAQs

    1. What inflation rate should I use for my calculation?

    While general economic inflation is often 3-4%, education inflation is much higher. For a conservative and safe plan, most financial advisors suggest using 8% to 10% for domestic education and accounting for currency fluctuations if planning for education abroad.

    2. Is it too late to start if my child is already 12?

    It is never too late, but your strategy will change. With only 6 years left, you have less time for market volatility, so you might need to save a larger monthly amount in “safer” instruments while still using the calculator to see the exact gap you need to bridge.

    3. Does the calculator account for living expenses?

    Most basic calculators require you to bundle those costs into the “Current Cost” field. To get an accurate result, always include the price of dorms, food, and travel in your initial “today’s price” estimate.

    Conclusion & CTA

    The journey to your child’s graduation begins long before they pick up a textbook. Understanding the impact of inflation is the difference between a future of financial stress and one of academic opportunity. Don’t let rising costs catch you off guard.

    Ready to take the first step? Use our Child Education Inflation Calculator now to get your personalized savings roadmap and secure your child’s seat in the classroom of their dreams!

  • Master Your Money: Side Hustle Income Tracker Guide

    Master Your Money: Side Hustle Income Tracker Guide

    Introduction

    So, you’ve joined the millions of “gig economy” go-getters. Whether you’re flipping vintage furniture on weekends, writing code after your 9-to-5, or driving for a rideshare app, you are officially a micro-entrepreneur. But here is the cold, hard truth: if you aren’t tracking your money, you aren’t running a business—you’re just busy.

    Managing multiple income streams can quickly turn into a mental jigsaw puzzle. Without a dedicated Side Hustle Income Tracker, it’s nearly impossible to know if you’re actually making a profit after gas, software subscriptions, and materials are paid for. Worse yet, tax season becomes a frantic scramble through crumpled receipts and bank statements. This guide explains how a tracking tool transforms that chaos into clarity, ensuring that every hour of your “extra” work truly pays off.

    What is a Side Hustle Income Tracker and Why it Matters

    A Side Hustle Income Tracker is a specialized system—ranging from a simple spreadsheet to a robust mobile app—designed to log every dollar that enters and leaves your side business. Unlike a standard personal budget, this tool focuses specifically on the “top-line” revenue (what clients pay you) and the “bottom-line” profit (what you actually keep).

    Why It’s Non-Negotiable

    • Tax Compliance: In many regions, earning as little as $400-$600 annually triggers a reporting requirement. A tracker ensures you have an audit-ready trail of your earnings.
    • Expense Optimization: Many new hustlers forget that “spending money to make money” is often tax-deductible. If you don’t track the $20 you spent on a premium LinkedIn account or the $50 in craft supplies, you’re essentially paying the government more than you should.

    Time Value Analysis: By tracking hours alongside income, you can see if your $50-an-hour consulting gig is actually a $10-an-hour slog once prep time is factored in. It helps you decide which “hustles” to scale and which to scrap.

    Step-by-Step Guide: How to Use Your Tracker Effectively

    Ready to get organized? Follow these steps to set up a system that works for you:

    • Step 1: Choose Your Platform. Decide between a manual Google Sheet, a dedicated app like QuickBooks Self-Employed, or a simple notebook. (Digital is usually better for searching and calculating).
    • Step 2: Create Your Categories. Standardize your labels. Common income categories include “Client Payments” or “Ad Revenue.” Expense categories should include “Software,” “Marketing,” “Travel,” and “Supplies.”
    • Step 3: Log Every Transaction Immediately. Don’t wait until the end of the month. Set a “Sunday Reset” ritual to enter any data you missed during the week.
    • Step 4: Digitize Your Receipts. Use your phone to snap photos of physical receipts. Most tracking tools allow you to attach these images directly to an expense entry.
    • Step 5: Separate Your Banking. Even for a small hustle, opening a separate (even if it’s just a second personal) bank account makes tracking 100% easier because you won’t have to filter out your grocery bills.
    • Step 6: Review Your Monthly “Net.” At the end of each month, compare your total income against your expenses to see your true growth.

    The Math Behind the Hustle: Understanding Profitability

    You don’t need an accounting degree to track your hustle, but you do need to understand two basic formulas. These numbers tell you the “health” of your side business.

    1. The Net Income Formula

    This is the most important number. It tells you exactly how much money is actually landing in your pocket after all costs.

    $$Net\ Income = Total\ Revenue – (Cost\ of\ Goods\ Sold + Operating\ Expenses)$$

    2. Profit Margin Percentage

    This tells you how efficient your hustle is. A higher percentage means you keep more of every dollar you earn.

    $$Profit\ Margin = \left( \frac{Net\ Income}{Total\ Revenue} \right) \times 100$$

    If you earn $1,000 but spend $400 on supplies, your Net Income is $600. Your Profit Margin is 60%. If your margin starts dropping below 20-30%, it’s a sign you need to either raise your prices or cut your costs.

    Real-Life Scenarios: See the Tracker in Action

    Scenario A: The Freelance Graphic Designer

    Sarah earns $2,000 in a month from three clients. She pays $50 for her Adobe subscription and $150 for a new font pack. Her tracker shows a Net Income of $1,800. Because she tracked her hours (40 hours total), she knows her “Effective Hourly Rate” is $45/hour.

    Scenario B: The E-commerce Crafter

    Mark sells $500 worth of hand-painted coasters on Etsy. He spends $200 on wood and paint, and Etsy takes $40 in fees. His tracker reveals his Net Profit is $260. While his revenue looked high ($500), his Profit Margin is 52%. This helps him realize he needs to buy supplies in bulk to lower his costs.

    FAQs: Frequently Asked Questions

    Q1: Do I really need to track income if I make less than $1,000?

    Yes. Even if you don’t owe significant taxes, tracking helps you understand if the side hustle is worth your time. Plus, if you ever want to scale it into a full-time business, having historical data is vital for getting loans or investors.

    Q2: What counts as a “tax-deductible” expense?

    Generally, any expense that is “ordinary and necessary” for your business. This can include a portion of your internet bill, home office space, mileage driven for work, and professional development courses.

    Q3: Should I use a spreadsheet or an app?

    Spreadsheets are free and highly customizable, but apps (like Wave or Mint) can often sync directly to your bank account, which saves hours of manual data entry. Start with a spreadsheet; upgrade to an app once you’re making more than $500/month consistently.

    Conclusion & CTA

    Tracking your side hustle income is the difference between having a hobby and having a business. By using a Side Hustle Income Tracker, you gain the power to make data-driven decisions, save money on taxes, and ultimately grow your wealth faster. Don’t let your hard-earned cash slip through the cracks of unorganized bank statements!

  • Master the Debt-Free Drive: Car Loan Prepayment Calculator Guide

    Master the Debt-Free Drive: Car Loan Prepayment Calculator Guide

    Buying a car is an exhilarating milestone, but the monthly sting of loan installments can quickly dampen the joy of the open road. If you’ve ever looked at your bank statement and wondered how much faster you could own your vehicle outright, you’re not alone. The secret isn’t just earning more—it’s paying smarter.

    A Car Loan Prepayment Calculator is the ultimate financial roadmap for anyone looking to shave months, or even years, off their debt. By making extra payments toward your principal balance, you aren’t just lowering your debt; you’re effectively “buying back” the interest you would have paid to the bank. Whether you’ve received a work bonus, a tax refund, or simply tightened your monthly budget, this tool shows you exactly how those extra dollars translate into freedom. In this guide, we’ll explore how small shifts in your payment strategy can lead to massive savings.

    What is a Car Loan Prepayment and Why it Matters

    In the world of financing, a “prepayment” refers to any amount paid toward your loan principal above and beyond your scheduled monthly installment. Most standard car loans are front-loaded with interest due to an amortization schedule. This means that in the early years of your loan, a larger chunk of your check goes to the bank’s profit rather than the actual car value.

    Why should you care?

    1. Interest Savings: Because interest is calculated based on the remaining principal, reducing that balance early significantly lowers the total interest accrued over time.

      Improved Cash Flow: Shortening your loan term means you reach a “payment-free” lifestyle sooner, freeing up hundreds of dollars for investments or travel.

      Equity Building: Cars are depreciating assets. Prepaying helps you stay “above water,” ensuring you don’t owe more than the car is worth if you decide to sell or trade it in.

      Using a Car Loan Prepayment Calculator empowers you to see the “future value” of your current money, turning abstract numbers into a concrete exit strategy.

    Step-by-Step Guide: How to Use the Calculator

    Using the tool is straightforward, but accuracy is key to getting a realistic timeline. Follow these steps to map out your savings:

    Gather Your Current Loan Details: You will need your current loan balance, the remaining term (in months), and your annual interest rate (APR).

    Input Your Regular Payment: Enter the amount you currently pay every month.

    • Define Your Prepayment Strategy: Most calculators offer two options:

      • Monthly Extra: A consistent amount added to every check (e.g., an extra $50/month).

      • One-Time Lump Sum: A single large payment (e.g., a $2,000 tax refund).

    • Adjust the “Start Date”: Select when you plan to begin these extra payments to see the most accurate impact.

    • Analyze the Comparison: The tool will generate a side-by-side view showing your “Original Payoff Date” vs. your “New Payoff Date.”

    • Check for Penalties: Before finalizing your plan, contact your lender to ensure your specific loan doesn’t have “prepayment penalties”—though these are increasingly rare in modern auto lending.

    The Math Behind the Savings

    You don’t need to be a mathematician to use the tool, but understanding the logic helps you appreciate the results. Car loans typically use the Simple Interest Formula, but the magic happens through Amortization.

    The interest for a single period is calculated as:

    $$I = P \times \frac{r}{n}$$

    Where:

    • $P$ is the remaining Principal balance.

    • $r$ is the annual interest rate (decimal).

    • $n$ is the number of payments per year (usually 12).

    When you make a prepayment, you are directly reducing $P$. Because the interest ($I$) for the next month is calculated based on that new, lower $P$, the amount of your “regular” payment that goes toward interest shrinks, and the portion that goes toward the principal grows. This creates a “snowball effect” where your debt disappears at an accelerating rate.

    Real-Life Scenarios

    Scenario A: The “Daily Coffee” Strategy

    Imagine Sarah has a $25,000 loan at 6% interest for 60 months. Her standard payment is roughly $483. By simply cutting back on small luxuries and adding $50 extra every month, she saves over $550 in interest and pays off her car 7 months early.

    Scenario B: The Tax Refund Boost

    Mark has the same loan but decides to make a one-time lump sum payment of $3,000 using his year-end bonus in the 12th month of his loan. This single action slashes his interest costs by nearly $1,100 and moves his “freedom date” up by 9 months.

    Frequently Asked Questions (FAQs)

    1. Will prepaying my car loan hurt my credit score?

    Initially, you might see a tiny, temporary dip when the account closes because you have one less “active” credit line. However, the long-term benefit of a lower debt-to-income ratio far outweighs this minor fluctuation.

    2. Is it better to pay a lump sum or monthly extras?

    Mathematically, the earlier you pay, the more you save. A lump sum at the beginning of the loan is more effective than the same amount spread over several years, as it stops interest from compounding sooner.

    3. Should I pay off my car loan if I have other debts?

    Generally, you should prioritize debts with the highest interest rates (like credit cards). If your car loan is at 4% but your credit card is at 22%, pay the card first!

    Conclusion & CTA

    A car is a tool for freedom, but a car loan can feel like an anchor. By utilizing a Car Loan Prepayment Calculator, you take the guesswork out of your financial future and take back control from the banks. Whether it’s an extra $20 a month or a one-time windfall, every dollar counts toward your goal of total ownership.

    Ready to see how much you can save? Use our Car Loan Prepayment Calculator today and find out exactly how soon you can toss those monthly bills out the window!

  • Freelancer Tax Calculator 2026: Estimate Your Self-Employment Savings

    Freelancer Tax Calculator 2026: Estimate Your Self-Employment Savings

    Managing your finances as a freelancer can feel like a full-time job in itself, especially when the tax season rolls around. Unlike traditional employees who see taxes disappear from their paychecks automatically, independent contractors, gig workers, and solopreneurs are responsible for calculating and paying their own way. With the updated Freelancer Tax Calculator 2026, you can take the guesswork out of your financial planning. This tool is designed to help you navigate the complexities of self-employment tax, income tax brackets, and those all-important deductions that keep more money in your pocket.

    Understanding your tax liability is about more than just compliance; it is about empowerment. When you know exactly how much to set aside for the IRS or your local tax authority, you can invest in your business with confidence. Whether you are a graphic designer in New York or a software developer in Lahore, our 2026 calculator adapts to the latest tax laws, including the 15.3% self-employment rate and the newly adjusted standard deductions. Let’s dive into how this tool works and why it is the most critical asset in your freelance toolkit this year.

    What is the Freelancer Tax Calculator 2026 and Why it Matters

    The Freelancer Tax Calculator 2026 is a specialized digital tool built to estimate the total tax burden for individuals who work for themselves. In a traditional job, your employer pays half of your Social Security and Medicare taxes (FICA). However, as a freelancer, you are both the employer and the employee, meaning you are responsible for the full 15.3% self-employment tax. This calculator simplifies that math, factoring in your gross income, business expenses, and specific 2026 tax year thresholds.

    Why does this matter? For starters, the Social Security wage base has increased to $184,500 for 2026. If you are a high-earner, failing to account for these shifts can lead to a massive “tax surprise” in April. Furthermore, the calculator helps you determine your Estimated Quarterly Payments. The IRS requires most freelancers to pay taxes in four installments throughout the year. If you underpay, you could face penalties. By using this tool, you ensure that you are staying compliant while also maximizing your “Above-the-Line” deductions, such as health insurance premiums and home office costs, which are vital for reducing your taxable income.

    Step-by-Step Guide: How to Use the Tool

    Using the Freelancer Tax Calculator 2026 is straightforward. Follow these steps to get an accurate picture of your financial standing:

    • Gather Your Gross Income: Total all the payments you have received (or expect to receive) from clients across the entire 2026 calendar year.

    • Input Business Expenses: Enter your “deductible” costs. This includes software subscriptions, hardware (like a new laptop), marketing fees, and travel.

    • Select Your Filing Status: Choose whether you are filing as Single, Married Filing Jointly, or Head of Household, as this significantly changes your 2026 standard deduction ($16,100 for individuals).

    • Account for Self-Employment Tax: The tool automatically applies the 15.3% rate to 92.35% of your net earnings (the portion the IRS deems taxable).

    • Review Your QBI Deduction: The calculator will estimate your Qualified Business Income (QBI) deduction, which typically allows you to deduct 20% of your business income from your federal income tax.

    • Download the Summary: Once the calculation is complete, save your results to help you set aside the correct amount in a high-yield savings account for tax day.

    The Math and Formula Behind the Calculations

    The magic of the Freelancer Tax Calculator 2026 lies in its multi-layered formulas. To calculate your total liability, the tool follows the IRS “Schedule SE” logic. First, it identifies your Net Profit, which is simply:

    $$\text{Gross Income} – \text{Business Expenses} = \text{Net Profit}$$

    However, you don’t pay self-employment tax on 100% of that profit. The IRS allows you to multiply your net profit by 0.9235 (92.35%) to account for the employer-portion deduction. The formula for your Self-Employment (SE) Tax is:

    $$\text{SE Tax} = (\text{Net Profit} \times 0.9235) \times 0.153$$

    For the Income Tax portion, the tool subtracts 50% of your SE tax and your Standard Deduction from your total income to find your taxable income. It then applies the 2026 progressive tax brackets (ranging from 10% to 37%). Finally, it subtracts the QBI Deduction, which is generally:

    $$\text{QBI Deduction} = \text{Net Business Income} \times 0.20$$

    Real-Life Scenarios: Tax Planning in Action

    To see how the numbers play out, consider these two common 2026 freelance profiles:

    Scenario A: The Creative Freelancer

    Sarah is a freelance writer earning $60,000 annually with $5,000 in expenses (internet, laptop, and coworking). Her net profit is $55,000.

    • SE Tax: ~$7,770

    • Income Tax: After the $16,100 standard deduction and QBI benefits, her income tax is significantly lowered.

    • Total Savings Needed: Sarah should set aside roughly 20-22% of her gross pay to be safe.

    Scenario B: The High-Earning Consultant

    Marcus is a tech consultant earning $200,000 with $20,000 in expenses. Because his income exceeds the $184,500 Social Security cap, he stops paying the 12.4% Social Security tax on everything above that limit. However, he must pay an additional 0.9% Medicare surtax on income over $200,000.

    • Benefit: Marcus saves thousands by hitting the Social Security ceiling.

    • Total Savings Needed: Marcus should set aside roughly 28-30% of his income.

    FAQs: Frequently Asked Questions

    1. Do I have to pay taxes if I earned less than $1,000?

    Yes, if your net earnings from self-employment were $400 or more, you are required to file a tax return and pay self-employment tax.

    2. What is the “92.35%” rule used in the calculator?

    The IRS realizes that regular employees only pay half of FICA. To make it fair, they let freelancers calculate their tax on only 92.35% of their earnings, which essentially mimics the deduction an employer would get.

    3. Can I deduct my health insurance premiums?

    Absolutely. As a freelancer, you can often take an “above-the-line” deduction for health insurance premiums for yourself, your spouse, and your dependents, provided you weren’t eligible for an employer-sponsored plan elsewhere.

    Conclusion & CTA

    Navigating the 2026 tax landscape doesn’t have to be a source of anxiety. By using a dedicated Freelancer Tax Calculator, you transition from “hoping for the best” to “planning for success.” Remember, every dollar you identify as a legitimate business expense or a QBI deduction is a dollar that stays in your business to help you grow.

    Ready to see your 2026 estimate? Use our Freelancer Tax Calculator today to get a precise breakdown of your obligations and start your path toward a stress-free tax season!

  • Why the SIP Delay Cost Calculator is Your Financial Wake-Up Call

    Why the SIP Delay Cost Calculator is Your Financial Wake-Up Call

    We’ve all been there. You tell yourself, “I’ll start my investment next month once I’ve cleared this credit card bill,” or “I’ll wait until I get that year-end bonus.” It feels like a small, harmless delay. After all, what’s a few months or even a couple of years in the grand scheme of a thirty-year career?

    The truth is, in the world of compounding, time is a much more powerful engine than the amount of money you invest. Delaying your Systematic Investment Plan (SIP) by even six months doesn’t just mean you missed six payments; it means you’ve lopped off the most profitable period of your investment’s life: the final years. The SIP Delay Cost Calculator is a specialized tool designed to show you exactly how much that “next month” is costing you in real dollars. It’s a reality check that quantifies the invisible price of procrastination, helping you bridge the gap between “someday” and “today.”

    What is an SIP Delay Cost Calculator and Why it Matters

    A SIP Delay Cost Calculator is a digital financial tool that compares two investment scenarios: starting your SIP today versus starting it at a later date. By inputting your intended monthly investment, the expected rate of return, and the duration of the delay, the tool calculates the “Opportunity Cost”—the wealth you lose because your money had less time to compound.

    Why It Matters

    The importance of this tool lies in its ability to expose the Power of Compounding. Compounding works exponentially, not linearly. This means the growth you see in Year 25 of an investment is significantly higher than the growth in Year 5. When you delay the start, you aren’t just missing the “early” interest; you are effectively deleting the “peak” interest years at the end of your cycle.

    Using this calculator matters because it shifts your perspective from saving to timing. Many investors wait until they have a “large enough” sum to start, but the SIP Delay Cost Calculator proves that starting small today is almost always better than starting large tomorrow. It provides the motivation needed to maintain discipline and highlights how a small delay of 2–5 years can potentially halve your final retirement corpus.

    Step-by-Step Guide: How to Use the SIP Delay Cost Calculator

    Using the tool is straightforward, but accuracy in your inputs will give you the most realistic “shock to the system.” Follow these steps to see your personal cost of delay:

    • Step 1: Define Your Monthly Contribution

    Enter the amount you plan to invest every month. Whether it’s $100 or $1,000, consistency is the key metric here.

    • Step 2: Set Your Investment Tenure

    Input the total number of years you plan to stay invested (e.g., 20 years until retirement).

    • Step 3: Estimate the Rate of Return

    Enter an expected annual return percentage. For equity-based mutual funds, many investors use a conservative estimate of 10% to 12% based on historical market averages.

    • Step 4: Input the Delay Period

    Specify how long you plan to wait before starting. You can usually toggle this between months or years. Try entering “1 year” just to see the impact.

    • Step 5: Analyze the Comparison

    The calculator will instantly generate two figures:

      1. The Target Wealth if you start today.

      2. The Target Wealth if you start after the delay.

    • Step 6: Review the “Cost of Delay”

      The difference between these two numbers is your cost of delay. This is the amount of wealth you are essentially “paying” for the privilege of waiting.

    The Math Behind the Magic: How It’s Calculated

    The SIP Delay Cost Calculator isn’t just guessing; it uses the standard Future Value (FV) of an Annuity formula. To understand the background science, we look at how interest is earned on both the principal and the accumulated interest over time.

    The formula for a standard SIP (invested at the beginning of the period) is:

    $$FV = P \times \left[ \frac{(1 + r)^n – 1}{r} \right] \times (1 + r)$$

    Where:

    • $P$ = Monthly investment amount.
    • $r$ = Monthly interest rate (Annual Rate / 12 / 100).
    • $n$ = Total number of months ($Years \times 12$).

    The Logic of Delay

    To find the cost of delay, the calculator runs this formula twice.

    1. Scenario A (No Delay): It uses the full $n$ (e.g., 240 months for 20 years).

    2. Scenario B (With Delay): It reduces $n$ by the number of months you delayed (e.g., 228 months if you delayed by one year).

    The “Cost of Delay” is simply $FV_A – FV_B$. The math proves that because $n$ is an exponent, even a small reduction in the value of $n$ leads to a massive drop in the final $FV$, especially as the tenure grows.

    Real-Life Scenarios: Seeing the Impact

    Let’s look at two practical examples to see how these numbers play out in the real world. In both cases, we will assume an expected annual return of 12%.

    Scenario 1: The “Just Five Years” Wait

    • The Goal: Invest $500/month for 25 years.

    • Start Today: Your final corpus would be approximately $948,817.

    • Delay by 5 Years: If you wait 5 years and invest for only 20 years, your corpus drops to $494,865.

    • The Cost: Waiting 5 years cost you $453,952—nearly half your potential wealth!

    Scenario 2: The “One Year” Procrastination

    • The Goal: Invest $1,000/month for 30 years.

    • Start Today: Your final corpus would be approximately $3,529,913.

    • Delay by 1 Year: Your final corpus drops to $3,141,400.

    • The Cost: That “harmless” 12-month delay cost you $388,513. You could have bought a house with the money lost to just one year of waiting.

    FAQs: Frequently Asked Questions

    1. Can I make up for a delay by investing more later?

    Yes, but it is expensive. To reach the same goal as someone who started early, you often have to double or triple your monthly investment. The calculator can help you find the “Step-up” amount needed to bridge that gap.

    2. Is the SIP Delay Cost Calculator accurate for all markets?

    The calculator uses a fixed rate of return for projection purposes. While real-market returns fluctuate, the principle remains the same: more time in the market beats trying to “time” the market.

    3. Does the cost of delay include inflation?

    Most basic calculators do not account for inflation. However, if you want a more realistic view, you can subtract the inflation rate (e.g., 5%) from your expected return (e.g., 12%) and enter 7% as your return rate in the tool.

    Conclusion & CTA

    The numbers don’t lie: time is the most valuable asset in your portfolio. As the SIP Delay Cost Calculator demonstrates, every month you spend on the sidelines is a month of compounding you can never get back. Don’t let the search for the “perfect” fund or the “perfect” time stop you from building your future.

    Ready to see what your “someday” is costing you? Use our tool today to calculate your specific delay cost and take the first step toward financial freedom. Start your SIP now—your future self will thank you.

    Know more: Smartcalc……….